
AI-native ClickHouse console for your cluster diagnostics and query generation, optimization and data visualization.
327
AI-native ClickHouse console for your cluster diagnostics and query generation, optimization and data visualization.

Local MCP server that lets AI assistants automate Origin/OriginPro for data and image processing.

🪄 Flint is a visualization language that lets AI agents reliably create expressive, good-looking charts from simple, human-editable chart specs.
One SQL interface for 60+ tools (e.g., GitHub, Notion, Airtable). Plug into any LLM through MCP.
Drop-in scientific plotting skill for Claude Code, Codex, Cursor, and other coding agents.

Give your AI agent accurate economic data. 330K indicators from FRED, World Bank, IMF, Eurostat & more. MCP server + web UI.

Governed, provenance-sealed creative rendering for Databricks — a Streamlit App + Unity Catalog ai_render() function that turns any governed source (Sample Lakehouse, UC, Genie, or BYO data) into infographics, reports, decks, video briefings, music, and podcasts.
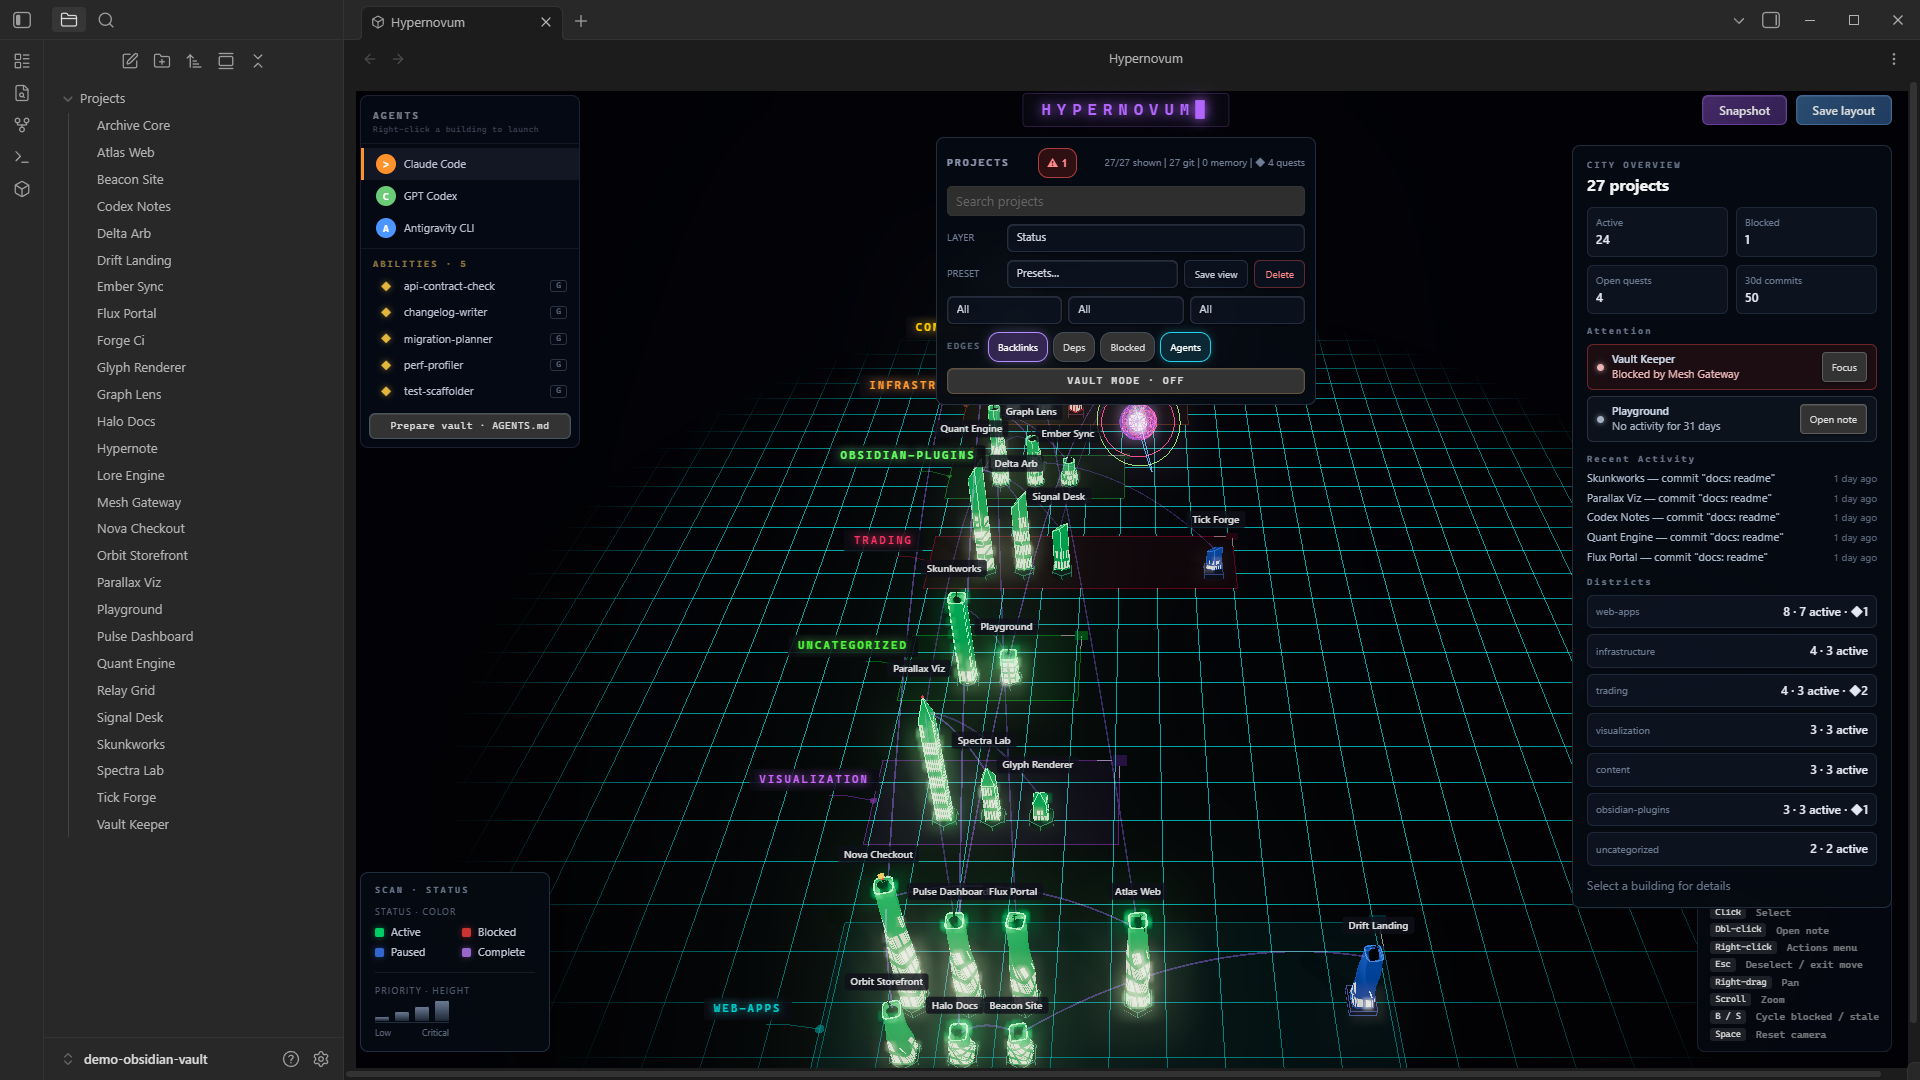
Agent Ops for your second brain - a 3D IDE for Obsidian built on Three.js. Visualize your vault as a code city, dispatch AI coding agents (Claude Code, Codex, Antigravity), post research quests, and watch your agent fleet work in real time.
Python toolkit, MCP server, and agent skills for reproducible, auditable clickstream and event log analytics. Helps AI agents, data scientists and analysts build, validate, and cross-check product analytics, quantitative UX, customer journeys, graph-based user flows, behavioral segmentation, A/B tests, process mining models, Markov chain simulation