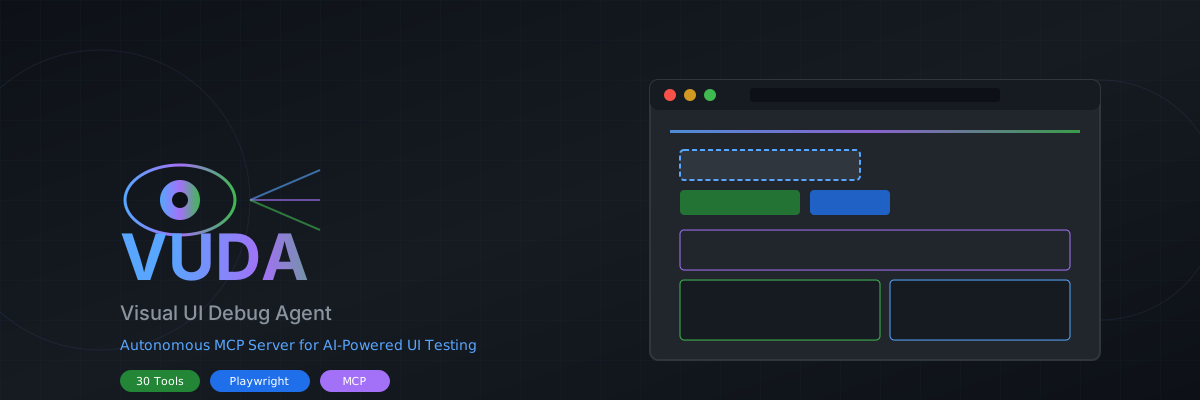


Give an MCP-compatible AI client a real browser, screenshots, DOM inspection, workflow validation, console capture, API checks, and visual comparison.
29 MCP tools · Local, Browserbase, Anchor, or any CDP browser · Node.js 20+
What VUDA does
VUDA (Visual UI Debug Agent) is a Model Context Protocol server for inspecting and testing web interfaces with Playwright. The MCP server runs locally over standard input/output; its browser can run locally, on Browserbase, on Anchor Browser, or at an existing CDP endpoint. Every tool uses the same selected browser runtime.
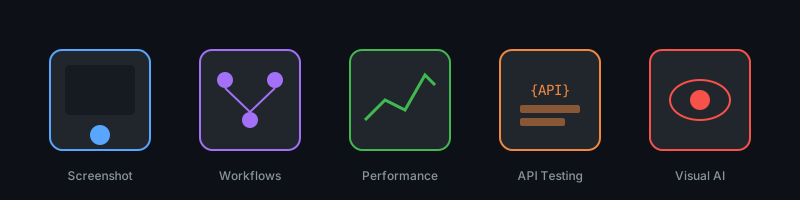
- Capture full-page, viewport, element, local-file, and batch screenshots.
- Map interactive elements and inspect rendered DOM and computed styles.
- Execute multi-step UI workflows while preserving browser state.
- Monitor console output and analyze page performance.
- Compare two rendered states and return a visual diff.
- Crawl sitemaps and exercise API endpoints.
- Emulate supported Playwright devices.
Quick start
1. Run VUDA
npx -y visual-ui-debug-agent-mcp
The default local mode needs a Chromium-compatible browser. If one is not already available, install the matching browser once:
npx playwright install chromium
2. Add it to an MCP client
{
"mcpServers": {
"vuda": {
"command": "npx",
"args": ["-y", "visual-ui-debug-agent-mcp"]
}
}
}
Restart the client after changing its MCP configuration. The server writes protocol messages to stdout and diagnostics to its temporary log file.
No provider account is required for local mode.
Docker users can use the same stdio transport:
{
"mcpServers": {
"vuda": {
"command": "docker",
"args": ["run", "--interactive", "--rm", "ghcr.io/samihalawa/visual-ui-debug-agent-mcp:latest"]
}
}
}
To use provider credentials from a file with Docker, add "--env-file", "/absolute/path/to/.env" immediately after "run" in the args array.
3. Try it
Ask your client to:
Use VUDA to inspect https://example.com, capture a screenshot, list the
interactive elements, and report console errors and obvious layout issues.
Tool reference
Analysis and capture
| Tool | Purpose |
|---|
enhanced_page_analyzer | Screenshot, console, performance, and interactive-element analysis |
screenshot_url | Capture a URL, viewport, full page, or selected element |
batch_screenshot_urls | Capture multiple URLs for side-by-side review |
screenshot_local_files | Render and capture local HTML files |
dom_inspector | Return element properties, children, and computed styles |
visual_comparison | Compare two rendered pages or elements |
Workflows, diagnostics, and APIs
| Tool | Purpose |
|---|
ui_workflow_validator | Execute and verify a described user journey |
navigation_flow_validator | Validate a sequence of browser actions |
console_monitor | Capture browser console messages over a time window |
performance_analysis | Collect navigation and page performance metrics |
api_endpoint_tester | Exercise multiple HTTP endpoints |
sitemap_crawler | Discover and inspect pages from a sitemap |
tunnel_helper | Store or retrieve a remote tunnel URL and setup guidance |
debug_memory | Keep small debugging notes during one server session |
Direct Playwright controls
playwright_navigate, playwright_click, playwright_iframe_click, playwright_fill, playwright_select, playwright_hover, playwright_evaluate, playwright_console_logs, playwright_get_visible_text, playwright_get_visible_html, playwright_go_back, playwright_go_forward, playwright_press_key, playwright_drag, and playwright_screenshot.
Configuration
VUDA reads environment variables normally and automatically loads .env from its working directory. Copy .env.example when running from a source checkout. For an npx installation, either put .env in the MCP process working directory, pass variables in the client configuration, or set DOTENV_CONFIG_PATH to an absolute .env path.
Choose the browser
| Mode | Required configuration | Account state |
|---|
| Local (default) | VUDA_BROWSER_PROVIDER=local | VUDA_STORAGE_STATE_PATH, cookie JSON, or a cookie file |
| Browserbase | VUDA_BROWSER_PROVIDER=browserbase, BROWSERBASE_API_KEY | Reuse BROWSERBASE_CONTEXT_ID or inject cookies |
| Anchor Browser | VUDA_BROWSER_PROVIDER=anchor, ANCHOR_API_KEY | Use an Anchor profile in VUDA_ANCHOR_SESSION_JSON or inject cookies |
| Existing browser | VUDA_BROWSER_PROVIDER=cdp, VUDA_CDP_URL | Uses that browser context; cookie injection is optional |
Browserbase example:
VUDA_BROWSER_PROVIDER=browserbase
BROWSERBASE_API_KEY=your_api_key
BROWSERBASE_PROJECT_ID=your_project_id
BROWSERBASE_CONTEXT_ID=your_saved_context_id
Anchor Browser example with a persistent authenticated profile:
VUDA_BROWSER_PROVIDER=anchor
ANCHOR_API_KEY=your_api_key
VUDA_ANCHOR_SESSION_JSON={"browser":{"profile":{"name":"vuda","persist":true}}}
All 29 tools keep their existing names and inputs in every mode. Read the MCP resource browser://status to confirm the selected provider, current connection state, session ID, and whether a live view is available. CDP and live-view URLs are never returned.
Import cookies or local state
Cookie injection works with every provider. Supply a Playwright cookie array inline or by file:
VUDA_COOKIES_FILE=/absolute/path/to/cookies.json
# VUDA_COOKIES_JSON=[{"name":"session","value":"...","domain":"example.com","path":"/"}]
For local mode, VUDA_STORAGE_STATE_PATH loads a Playwright storage-state file. Set VUDA_PERSIST_STORAGE_STATE=true to write the updated state back when VUDA exits cleanly. Browserbase Contexts and Anchor profiles are the provider-native choices for state that must survive multiple cloud sessions.
Provider-specific session options remain available without another wrapper or SDK:
VUDA_BROWSERBASE_SESSION_JSON is merged into Browserbase's create-session request.VUDA_ANCHOR_SESSION_JSON is sent as Anchor's create-session request.
Timeouts
All timeout settings are optional:
| Variable | Default | Purpose |
|---|
VUDA_DEFAULT_TIMEOUT | 15000 | General Playwright timeout in milliseconds |
VUDA_NAVIGATION_TIMEOUT | 15000 | Navigation timeout |
VUDA_SELECTOR_TIMEOUT | 12000 | Selector wait timeout |
VUDA_STABILITY_WAIT | 5000 | Delay after navigation before capture |
VUDA_UI_UPDATE_WAIT | 1000 | Delay for short UI updates |
VUDA_PERFORMANCE_THRESHOLD | 15000 | Slow-page threshold |
VUDA_INTERACTION_DELAY | 500 | Delay between direct interactions |
Example:
{
  "mcpServers": {
    "vuda": {
      "command": "npx",
      "args": ["-y", "visual-ui-debug-agent-mcp"],
      "env": {
        "VUDA_NAVIGATION_TIMEOUT": "30000",
        "VUDA_STABILITY_WAIT": "2000"
      }
    }
  }
}
Development
git clone https://github.com/samihalawa/visual-ui-debug-agent-mcp.git
cd visual-ui-debug-agent-mcp
npm ci
npm test
npm test builds the TypeScript server, starts it through the MCP stdio transport, verifies the exact 29-tool inventory, reads a bundled resource, exercises a stateful tool call, and captures a real browser screenshot.
It also validates Browserbase and Anchor session request/cleanup shapes, CDP selection, cookie loading, and the crawler's browser initialization. Provider calls use deterministic mocks in CI; use your own .env for a live cloud session.
Before opening a pull request, also run:
npm audit
npm pack --dry-run
Architecture
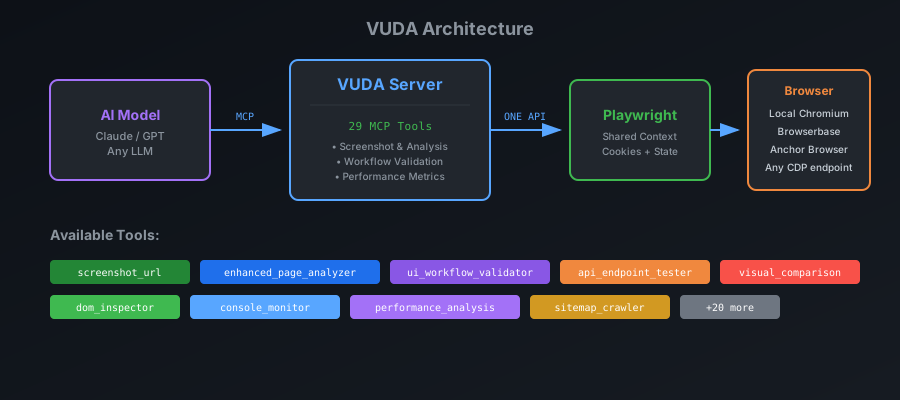
VUDA keeps one Playwright control plane across all providers. Local mode creates isolated contexts for page-level analyses; remote modes reuse the provider context so authenticated state survives across tools. VUDA returns screenshots as MCP image content and exposes generated screenshots, browser status, and debugging prompts as MCP resources.
Contributing
Issues and focused pull requests are welcome. See CONTRIBUTING.md for the development workflow and review checklist. Release history is recorded in CHANGELOG.md.
License
ISC © 2023–2026 Sami Halawa and contributors.