Token Optimizer MCP
Spend less context, keep the conclusions, and audit every claim across 16 coding clients.







One local ledger for optimizer tools, live-graph substitutions, every agent, and the graph's own cost.
The 30-second version
Your agent burns most of its context on work it already did: re-reading files
that have not changed, dumping a whole file to see three lines, running
unbounded searches, and re-deriving conclusions it reached last session and then
forgot.
Token Optimizer attacks that on four fronts.
1. It makes the expensive call impossible. Install the plugin and a built-in
Read of a 200 KB file is denied, with the refusal naming the cached,
diffed replacement. Same for Grep, Glob, Edit, Write, and cat /
head / grep -r through the shell. Re-reading a file you already read this
session returns only a diff — usually the single biggest win, and one that
size-based rules structurally cannot catch. There is no setting to turn on.
2. It remembers what your agent worked out. A per-project knowledge graph
accumulates findings, decisions and dead ends as a side effect of working, then
feeds them back the moment the agent touches the relevant file. A finding costs
~150 tokens to carry. Re-deriving it costs 5k–50k.
3. It measures itself, in public, and tells you when it is losing. A
materialized before/actual-return measurement for MCP progressive disclosure,
with later expansions debited from the same net. Modeled graph substitutions
and the randomized control arm for downstream graph effects remain separate.
Every number is measured, visibly collecting, excluded, or absent.
4. It attributes the traffic. Returned context, optional cost equivalents,
and net transport avoided are grouped by operation and MCP handshake identity. Codex, Claude Code,
Gemini, and any other connected client get separate rows. Old records without
identity remain explicitly unattributed instead of being assigned to whichever
agent happens to be open now.
No account, no telemetry, no hosted service. MIT, so it is usable at work.
What the dashboard proves on a real machine
The screenshots in this README come from the shipped server reading persisted
local data, not a design mockup. In the capture above it reports:
- 43,491 net verified MCP transport tokens avoided in the current live
proof: 54,037 gross reduction minus a deliberate 10,546-token expansion;
- 486,074,740 historical/tool-reported tokens quarantined, dominated by
repository scan volume that never entered model context;
- a live Codex / Claude Code / Gemini stdio smoke against AiDotNet, with each
client attributed independently;
- 2,648 graph nodes, 6,527 edges, and 58 findings across 11 local projects;
- more than 1,000 hook runs with zero failures and zero timeouts across six
active CLI clients in the selected rolling 24-hour window;
- 6,332 tokens of modeled graph-substitution potential, excluded from the
verified headline while the causal graph-reuse study remains
Collecting.
The dashboard now reads native CLI usage receipts and prices uncached input,
cache reads, cache writes, and output with the exact captured provider, model,
route, request-time tier, and versioned official source. Ambiguous model ids stay
Not priced instead of receiving a blended guess. API/list-price equivalents
are kept separate from provider-reported charges and are never labeled as a
subscription invoice. See the token accounting contract.
Quick start
Claude Code — install the plugin, not the bare MCP server. The plugin is
what enforces; adding the server alone just gives the model tools it can ignore.
/plugin marketplace add ooples/token-optimizer-mcp
/plugin install token-optimizer@token-optimizer
/reload-plugins
That is the entire installation. All sixteen clients →
Then, whenever you want to know what to do next:
token_audit
One ranked queue: what is costing the most per session, with an optional monthly
cost equivalent only after you configure your own effective rate. Each line
names how to fix it. Not a dashboard, not six reports — a queue.
The knowledge graph — the part nothing else has
Every agent session ends the same way: the reasoning evaporates. The next
session re-derives it, at full price, forever.
This builds a living per-project graph — nodes for files, symbols, tasks and
findings; edges for derived_from, contains, supersedes, contradicts,
related — and it fills itself in from real work. No ingestion job, no
embedding model, no rebuild step, no query to formulate.
you touch  src/auth.ts
           │
           ├─ verify() compares exp against the LOCAL clock          (finding, 0.9)
           ├─ per-host retry budgets; global was rejected — deadlock (decision)
           ├─ ! the skew fix was reverted once already               (dead end)
           └─ [git] 47 changes in 90d, last three: "fix token expiry",
                    "revert skew fix", "fix token expiry again"
None of that is in your repository. It exists only because an agent once burned
tokens finding it out — and every other tool throws it away at the end of the
session.
What a default install actually produces. The structural graph — files,
symbols, tasks, and the edges between them — is captured from ordinary tool
traffic with no configuration at all. Findings are produced two ways. At session
end, derive reads evidence already on disk (command outcomes and exit codes,
red-to-green transitions, corrections, re-read churn) and writes findings from
it: no model call, no credential, nothing sent anywhere. And the active model
records durable conclusions itself through wiki_write.
The model-based semantic harvest is the third path, and the only one that
needs something you do not already have. It is not opt-in —
TOKEN_OPTIMIZER_HARVEST=0 turns it off — but its real gate is a credential:
with none it reports off:no-key, which is the state on CI, corporate machines,
and subscription-only logins. Point TOKEN_OPTIMIZER_HARVEST_ENDPOINT at a
local model and it runs free and private, with nothing leaving the machine.
npx token-optimizer-doctor states which of these is live.
Why this is not RAG
| Classic RAG | This |
|---|
| Retrieves evidence; the model re-derives meaning each time | Retrieves verdicts — the reasoning already happened |
| Index built by a batch ingestion job | Accretes from real agent traffic — coverage follows attention |
| Similarity search | Traversal — this symbol and its callers |
| Model must formulate a query | Fires when the model reaches for a file |
| Staleness invisible; serves rotted chunks confidently | Staleness computed from content hashes, served with the invalidating diff |
| Returns only what is in the documents | Returns dead ends, which exist nowhere in your source tree |
Traversal plus lexical search: deterministic, instant, explainable, and it works
offline.
The zero-turn refusal
A plain deny costs a full turn: the model calls Read, is refused, re-plans,
calls smart_read. But at refusal time we already hold the file and the
snapshot the graph stored — so the refusal carries the answer inside it.
Nothing to re-plan, no second call. Turn cost drops from one to zero.
And when the graph already holds the verdict a tool output would support, the
output never enters context at all. Not compressed. Absent.
The dashboard
npm install
npm run build
npm run dashboard      # http://localhost:3100
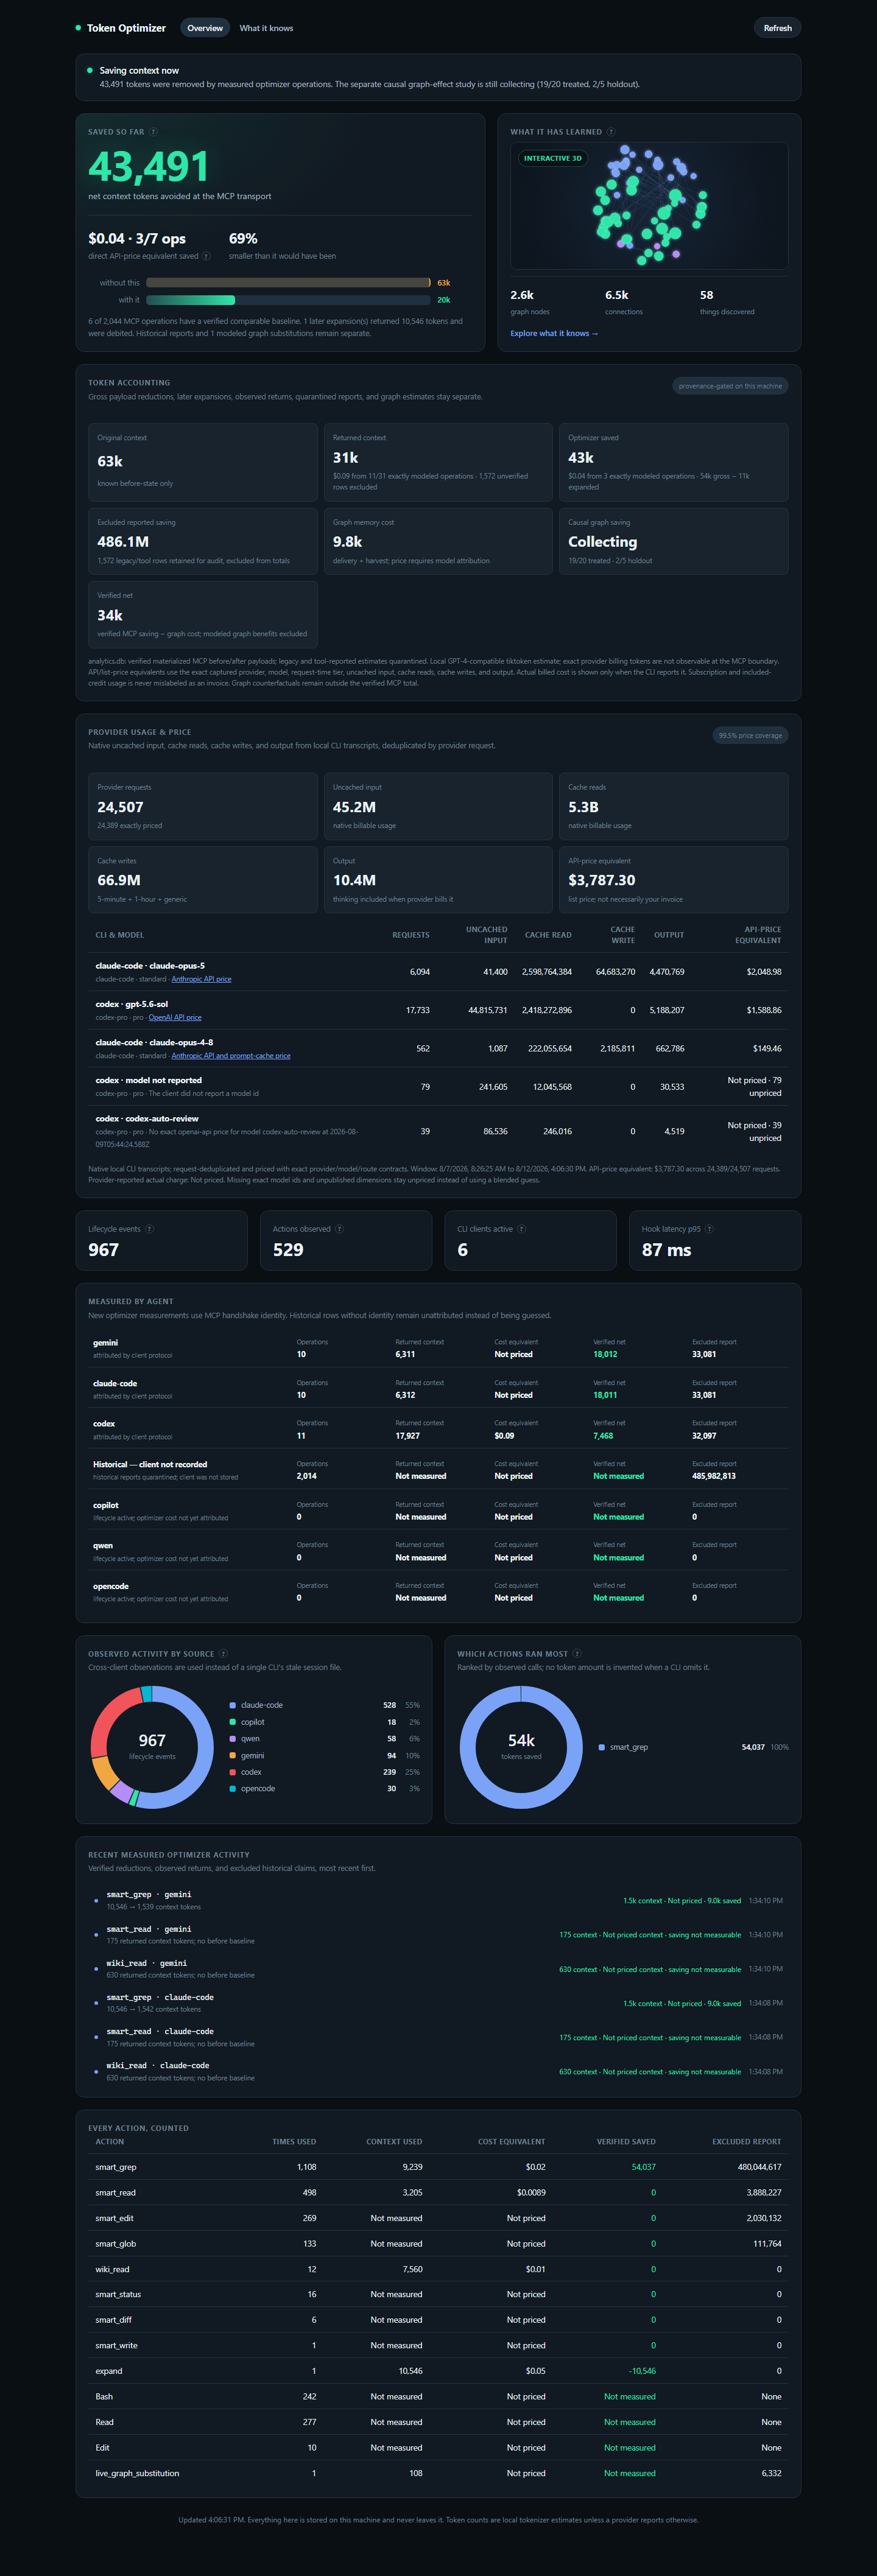
The overview answers the questions a token optimizer should answer first:
- How much MCP context did it avoid? The headline is gross materialized
payload reduction minus every later linked expansion. Graph estimates are
intentionally separate.
- How much context still reached the agents? Every successful current MCP
result records its actual returned text, even when no valid before-state
exists. That row is context-accounted but savings-unmeasured.
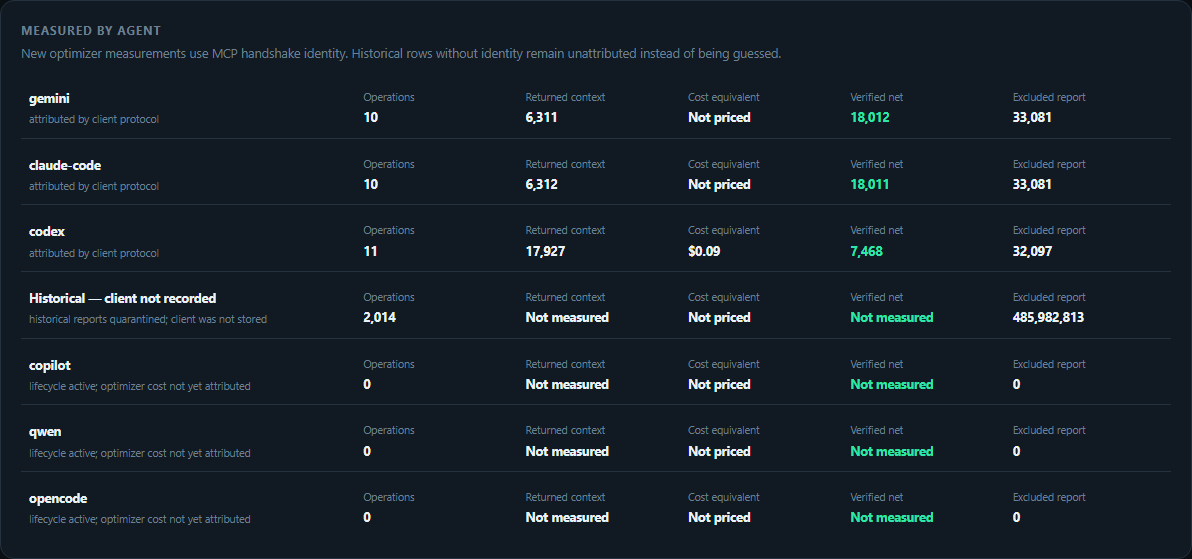
- Which agent and action spent it? The client ledger and action table show
operations, returned context, optional cost equivalent, and net tokens
avoided. Lifecycle-only clients say
Not measured; no zero is invented.
- Did remembering cost more than it saved? Delivery and semantic-harvest
tokens are charged to the graph. A causal benefit is added only after the
treated/holdout evidence gate passes.
Walkthrough: get useful data, not an empty dashboard
- Install the MCP server and the native adapter for your CLI. The MCP handshake
provides per-client accounting; native lifecycle hooks provide automatic
routing, capture, health, and delivery where the client protocol permits it.
- Use
smart_read, smart_grep, smart_glob, smart_edit, or any other MCP
operation normally. Every successful result records returned context; tools
with a comparable materialized before-state also record a gross reduction;
later expand calls debit that reduction.
- Let the active model record durable conclusions with
wiki_write. Before a
new agent re-derives work, call wiki_read for the project or the files it is
about to touch. Native clients can also deliver matching knowledge
automatically.
Use wiki_query to read the graph directly — one finding by key, a ranked
BM25 search over claims, a node with its neighbours, or the graph's own audit
— which is how a subagent that never sees the SessionStart briefing reaches
what previous sessions established.
- Open
http://localhost:3100. Use Overview for combined accounting and
What it knows for capture health, graph exploration, audits, and causal
evidence.
- To register existing local repositories without reading their source, run
npm run projects:discover -- /absolute/path/to/repos. This makes coverage
gaps explicit; it does not fabricate findings.
For maintainers, this live smoke exercises the shipped stdio transport and
creates separately attributed rows without seeding the analytics database:
npm run dashboard:attribution-smoke -- /absolute/path/to/project /absolute/path/to/large-file
npm run dashboard:verify-live -- http://localhost:3100
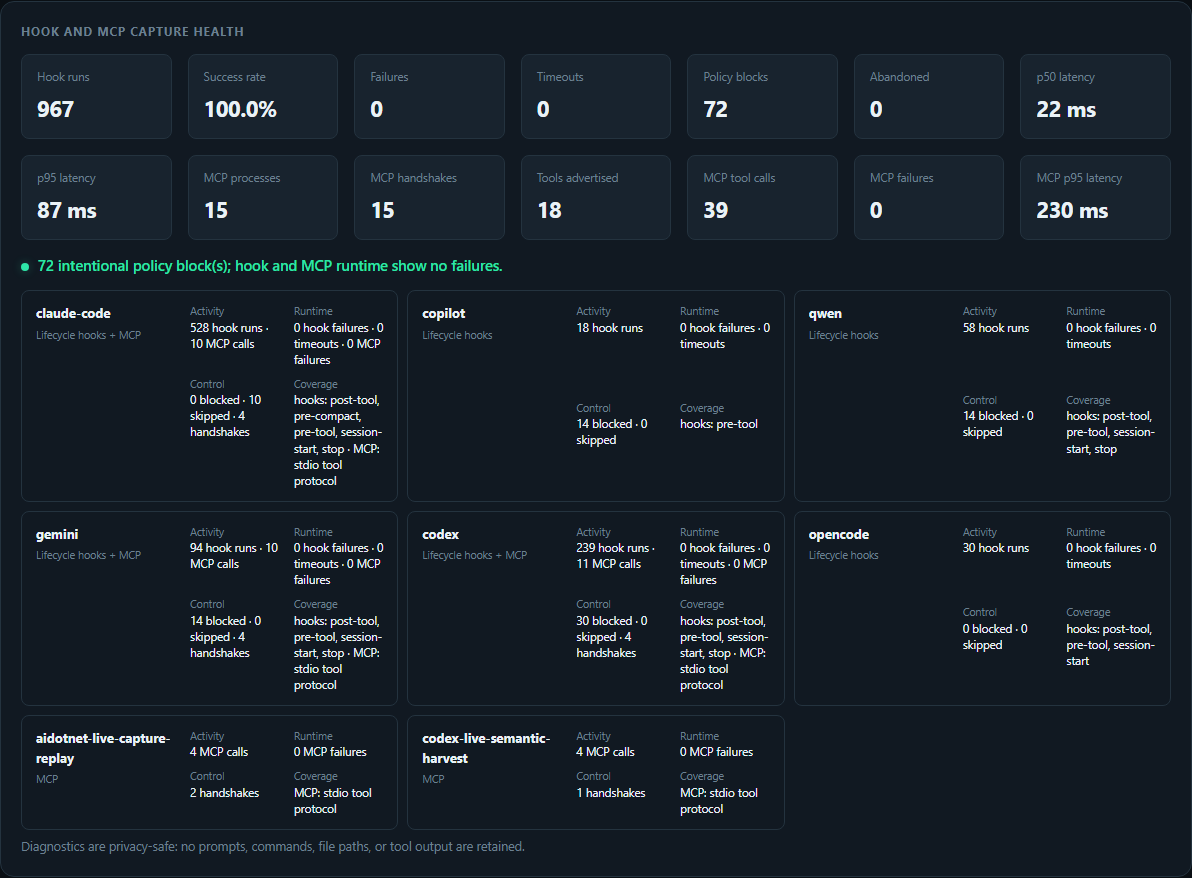
The health panel is deliberately operational rather than a raw text dump. Each
client has activity, runtime failures/timeouts, policy outcomes, and observed
surface coverage. Diagnostics keep no prompts, commands, paths, or tool output.
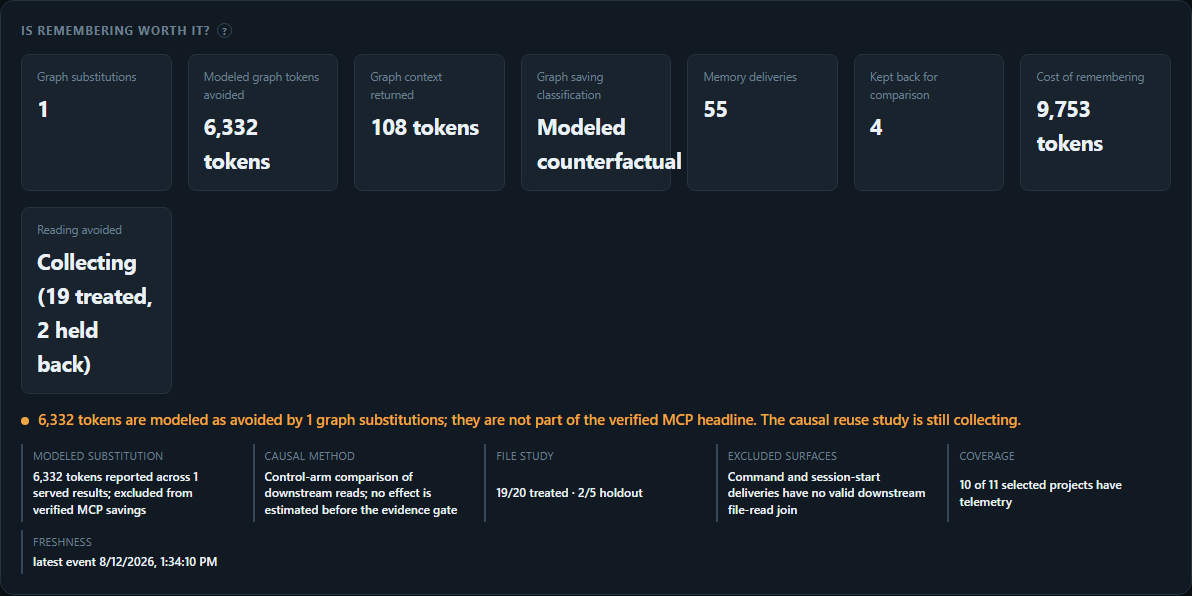
Modeled substitution potential and causal graph effects are different claims.
The first is a full-file counterfactual and is never promoted to the verified
MCP headline. The second asks whether delivered knowledge prevented later reads;
it uses a control arm and remains Collecting until there are at least 20
treated file touches and 5 holdouts with valid downstream joins.
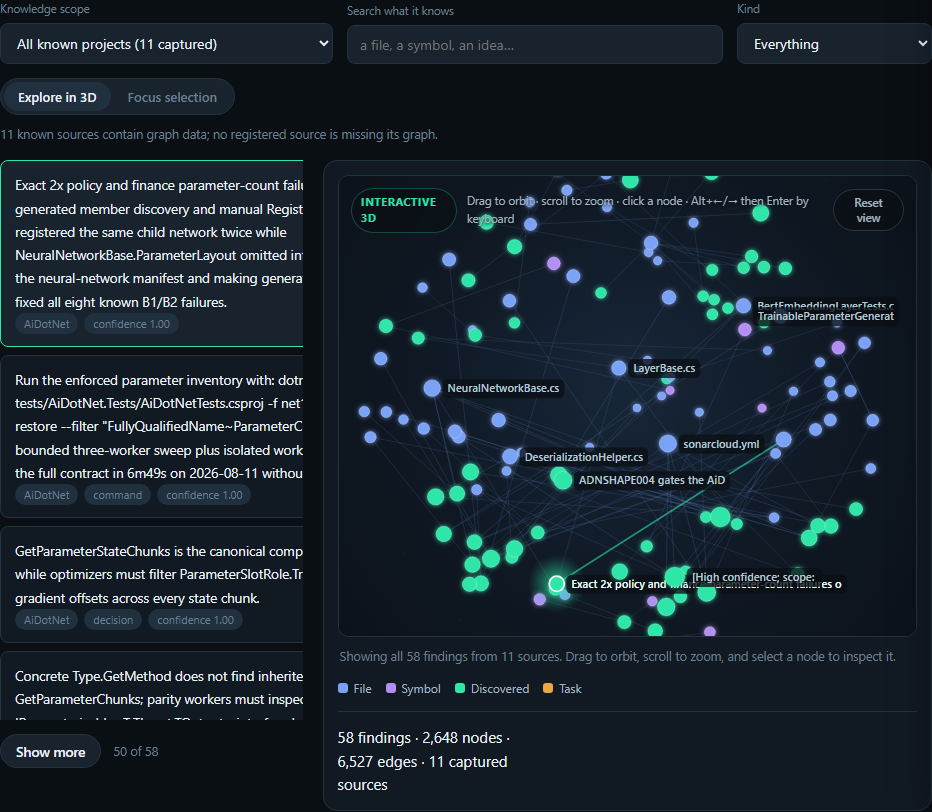
Drag to orbit, scroll to zoom, click a node for provenance, or switch to the
bounded one-hop focus view. The default All known projects scope pools local
graphs through opaque project IDs; filesystem paths never reach the browser.
Audit tab. Contradictions, stale findings, and low-confidence claims remain
reviewable instead of silently becoming model truth.
Evidence console. Client/model/task cohorts, matched effects with 95%
intervals, live outcome joins, harm feedback, and capability tiers for all 16
clients. Release and superiority claims fail closed while evidence is missing.
One-click Markdown export. The accumulated graph becomes documentation you
can inspect, edit, and commit.
Server-side by design: the browser asks for a neighbourhood, a search result or
a page. A mature graph holds thousands of nodes, and shipping it wholesale would
make every page load a multi-megabyte download for a view that shows twenty
things.
The default All known projects scope combines captured graphs through an
opaque machine-local project registry; filesystem paths never reach the
browser. Lifecycle hooks register repositories as they are used. To backfill
existing local checkouts without reading their source files, run the bounded
discovery command against one or more explicit roots:
npm run projects:discover -- /absolute/path/to/repos /absolute/path/to/worktrees
Coverage distinguishes repositories with graph data from known repositories
whose capture has not started. The balance cards are backed by persisted events:
Memory deliveries counts graph context actually supplied to an agent,
Kept back for comparison counts randomized control touches, and Cost of
remembering combines delivered-context tokens with measured semantic-write
payload cost. Reading avoided stays Collecting or Not measured until at
least 20 treated file touches and 5 holdouts exist with a downstream join; the
dashboard does not manufacture a savings estimate from missing data.
See the causal evidence protocol, the
cross-client capability contract, and the
live evaluation suite.
Cross-client lifecycle diagnostics
Every native hook writes the same bounded JSONL lifecycle record, including
Claude Code's custom router and compaction paths. Records carry the client and
plugin versions, event, hashed session/turn correlation, latency, outcome,
input/output byte counts, and response key shape. They deliberately retain no
prompt, command, tool output, file content, or raw working-directory path. The
fields include OpenTelemetry log severity and resource semantics so the local
files can be collected without inventing a second schema.
npm run diagnostics                         # last 24 hours, summary-first JSON
npm run diagnostics -- --hours 72 --output hook-summary.json
npm run diagnostics -- --include-events --limit 100 --output hook-report.json
Raw event rows are opt-in and capped at 1,000. The default report contains aggregate health and
at most twenty recent failures/timeouts, keeping routine troubleshooting output small enough for
CLI and model context windows.
The dashboard's Capture health panel shows runs, failures, timeouts and
p50/p95 latency by client. Logs rotate at 5 MiB, retain at most 40 files for 14
days, and live under .token-optimizer/logs when a state directory is set (or
~/.token-optimizer/logs otherwise). TOKEN_OPTIMIZER_LOG_DIR,
TOKEN_OPTIMIZER_LOG_MAX_BYTES, TOKEN_OPTIMIZER_LOG_MAX_FILES, and
TOKEN_OPTIMIZER_LOG_RETENTION_DAYS override those operational defaults.
What it does that other optimizers do not
Compaction is consolidation, not loss
Everyone else checkpoints and restores what you had — which spends the
scarcest budget in the session replaying context you already paid for.
Selection here is derived, not a category list: cost-to-rederive × irrecoverability × reuse-probability, with dead ends and decisions on a floor,
because cheap-to-find is not the same as cheap-to-find-again. Restoration then
adapts to the situation — mid-problem, cold resume, or in-flow — within a
measured budget:
Where you were: does clock skew explain the 401s?
ruled out: token signing, clock drift on the client
untested: NTP skew on the server
That is resuming a thought. A summary describes one.
Progressive disclosure that knows what you asked
A large tool result becomes a preview chosen by the session's actual
question, after parsing the output's shape (test report, diff, stack trace,
log, JSON) — not the first 40 lines because they are first.
[selected against: "which shard fails?"]
--- failures ---
  FAILED  DBNetTests.BceOnRelu -- expected 0.0 got NaN
  FAILED  TftGradientFlow -- gradient did not reach the encoder
---- omitted: 1,760 lines of passing tests (expand 8bb6bd66) ----
Every cut is named, because a model reasoning over a silent truncation
cannot know it is missing anything. expand serves from a content-addressed
store — it never re-runs your test suite — and expanding both teaches the next
preview and promotes what you needed into the graph, so the second expansion
never happens.
Prompt-cache economics, measured from your own transcript
Provider caches are billable and provider-specific; a cache hit is not a free
input token. For example, Anthropic publishes separate cache-read and
cache-write multipliers, while OpenAI and Gemini expose their own cached-input
usage and pricing rules. Token Optimizer reads native cache fields when the
client supplies them and keeps reads, writes, uncached input, and output
separate. It never applies one provider's cache multiplier to another client.
The attribution view then does the part a hit rate cannot:
! CLAUDE.md:2 has an embedded timestamp, invalidating everything after it
    about 329,421 tokens re-written per session
Attributed to a line, priced by what sits behind it. Keep-warm is decided by
expected value from your observed gaps, per TTL tier — and when neither tier
pays, it says so.
Model routing decided by outcomes, not by task size
Everyone guesses from task shape and never checks. This reads which model ran
each episode and what happened — retries, errors, turns — and prices both
mistakes: what an overpowered model wastes, and what an underpowered one costs
in retries. A tier that needs a retry in more than half its episodes is excluded
at any price, because four cheap turns that fail are not cheap.
Waste detection that becomes a ratchet
A report is read once and forgotten. Here a detection produces a durable,
measured, reversible fix — a skip rule, a composite touch — plus a ~50-token
session-start briefing so the waste never starts. Detectors are a shipped floor
plus patterns derived from your project's own history, each carrying what it
has actually saved:
generated/schema.d.ts: read in 9/9 sessions, never the source of a finding
    3,400 tokens/session; cost equivalent not priced; apply: waste_audit action="apply"
Anything that touches your files is proposed as a diff and never applied.
One audit across every project
fleet_audit ranks your whole machine by measured cost, and does something a
per-project scanner cannot: a fix proven in one project is offered to the others
containing the same file contents, carrying the evidence from where it was
measured. Matching is by content hash, never by filename.
It also runs the natural experiment nobody else can — enforcing clients versus
directive ones — and reports it whichever way it falls, with the confound
stated.
Trust: we ship hooks that refuse your tool calls
That is a bigger ask than a normal dependency makes, so:
Verify the release. Published from CI with npm provenance — npm audit signatures ties the artifact to the workflow run and the commit, without
trusting us. CHECKSUMS.sha256 ships alongside for offline checking.
If nothing seems to be happening, the lifecycle bundle is probably not
installed. An MCP server process cannot modify the host that launched it, and
npm 11 gates lifecycle scripts behind allow-scripts. Install the native
plugin/hook bundle listed for your client below; adding only the MCP server gives
the model tools but no pre-execution veto. For a legacy global Claude Code
installation, recovery is one line:
npx token-optimizer-install     # wire Claude Code hooks
npx token-optimizer-doctor      # prove the Claude hooks work
Check that it works — not that files exist.
npx token-optimizer-doctor # or npm run doctor, from a clone
It feeds a synthetic payload to the real hook binary and asserts a large read
is refused and a small one is not. A checklist would have passed on the exact
bug this project once shipped, where the plugin was connected, visible in
/mcp, and saving nothing. Every failure names its own fix.
Every refusal carries its own off switch. Enforcement that hides its disable
is coercive, and the person who needs it is mid-refusal, not reading a README:
auth.ts is 91 KB. Call smart_read instead.
(Not what you wanted? TOKEN_OPTIMIZER_MODE=off disables enforcement.)
Removal is exact. The installer records every file it wrote, with hashes.
Uninstall removes only what still matches; anything you edited since is left in
place and named. Your own hooks are never touched, and we never rewrite your
settings.json — we merge into it.
npm run uninstall-hooks              # show the plan; changes nothing
npm run uninstall-hooks -- --apply   # carry it out
It separates direct savings from causal graph evidence
Every tool in this space reports "tokens saved" computed from its own
assumptions. That number cannot be wrong, because nothing checks it.
For optimizer results, this records the materialized before-state and the text
actually r