

WORKS WITH · Claude Code · Cursor · Codex · Windsurf · Zed · any MCP client
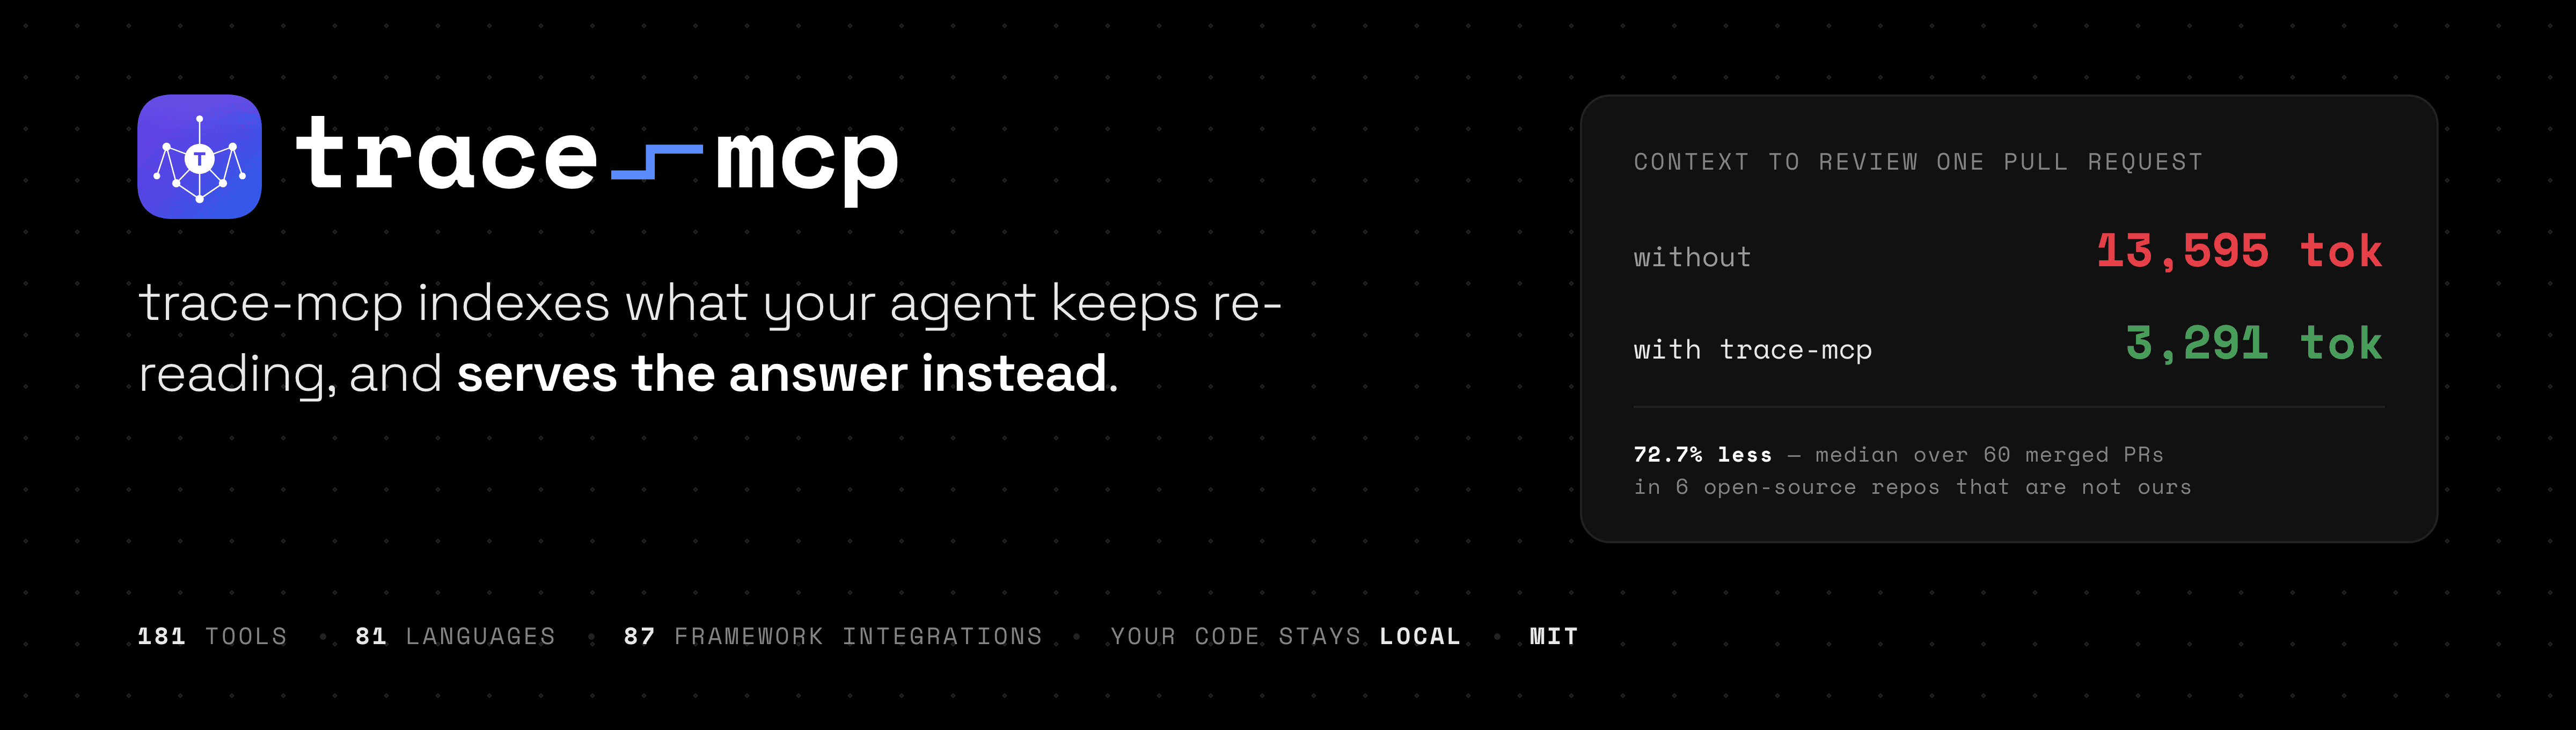
trace-mcp indexes what your agent keeps re-reading, and serves the answer instead.
72.7% fewer input tokens to review a pull request — median over 60 merged pull requests in open-source repos we don't own.
We change configuration you could change yourself. We do not patch your client's binary, intercept its traffic, or rewrite its files.


npm install -g trace-mcp   # MCP server, no app
trace init                 # wire it into your agent, once per machine
trace add                  # index the repo you are in
72.7% fewer input tokens to review a pull request — median over 60 merged PRs in six repos that are not ours, 13,595 → 3,291 per pull request. Method and reproduction →
Measured at trace-mcp 3.23.2 (cb8ab30c) on 7 September 2026 — a result from that build, not a claim about the current one. What it set out to measure, the bar it had to clear and the verdict: preregistration.
Cheaper is not the same as better, so the same 60 pull requests were reviewed twice and scored blind. The trace-mcp arm understood the change in 67% of them against 65% for naive file loading, at 0.80 false positives per PR against 0.58. Quality half of the benchmark →
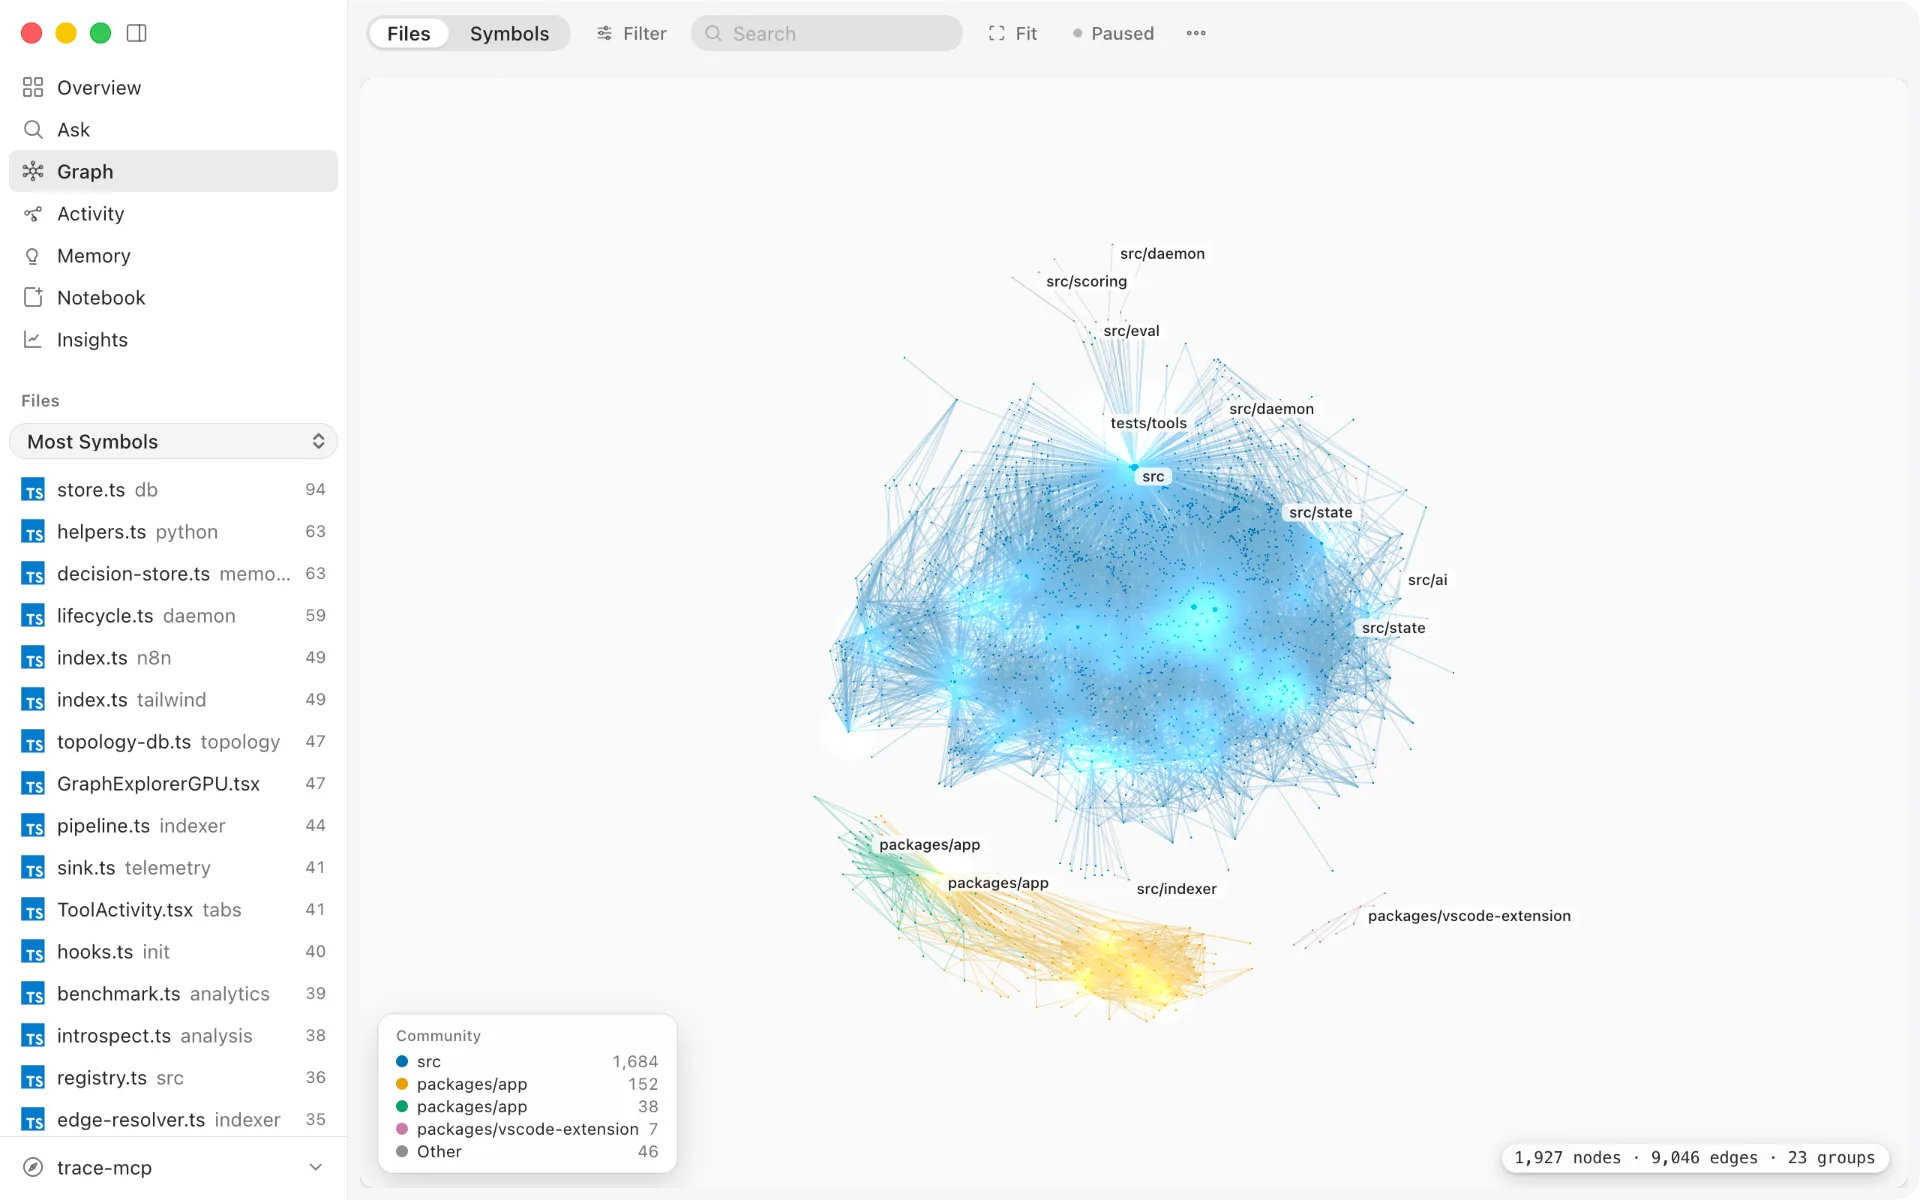
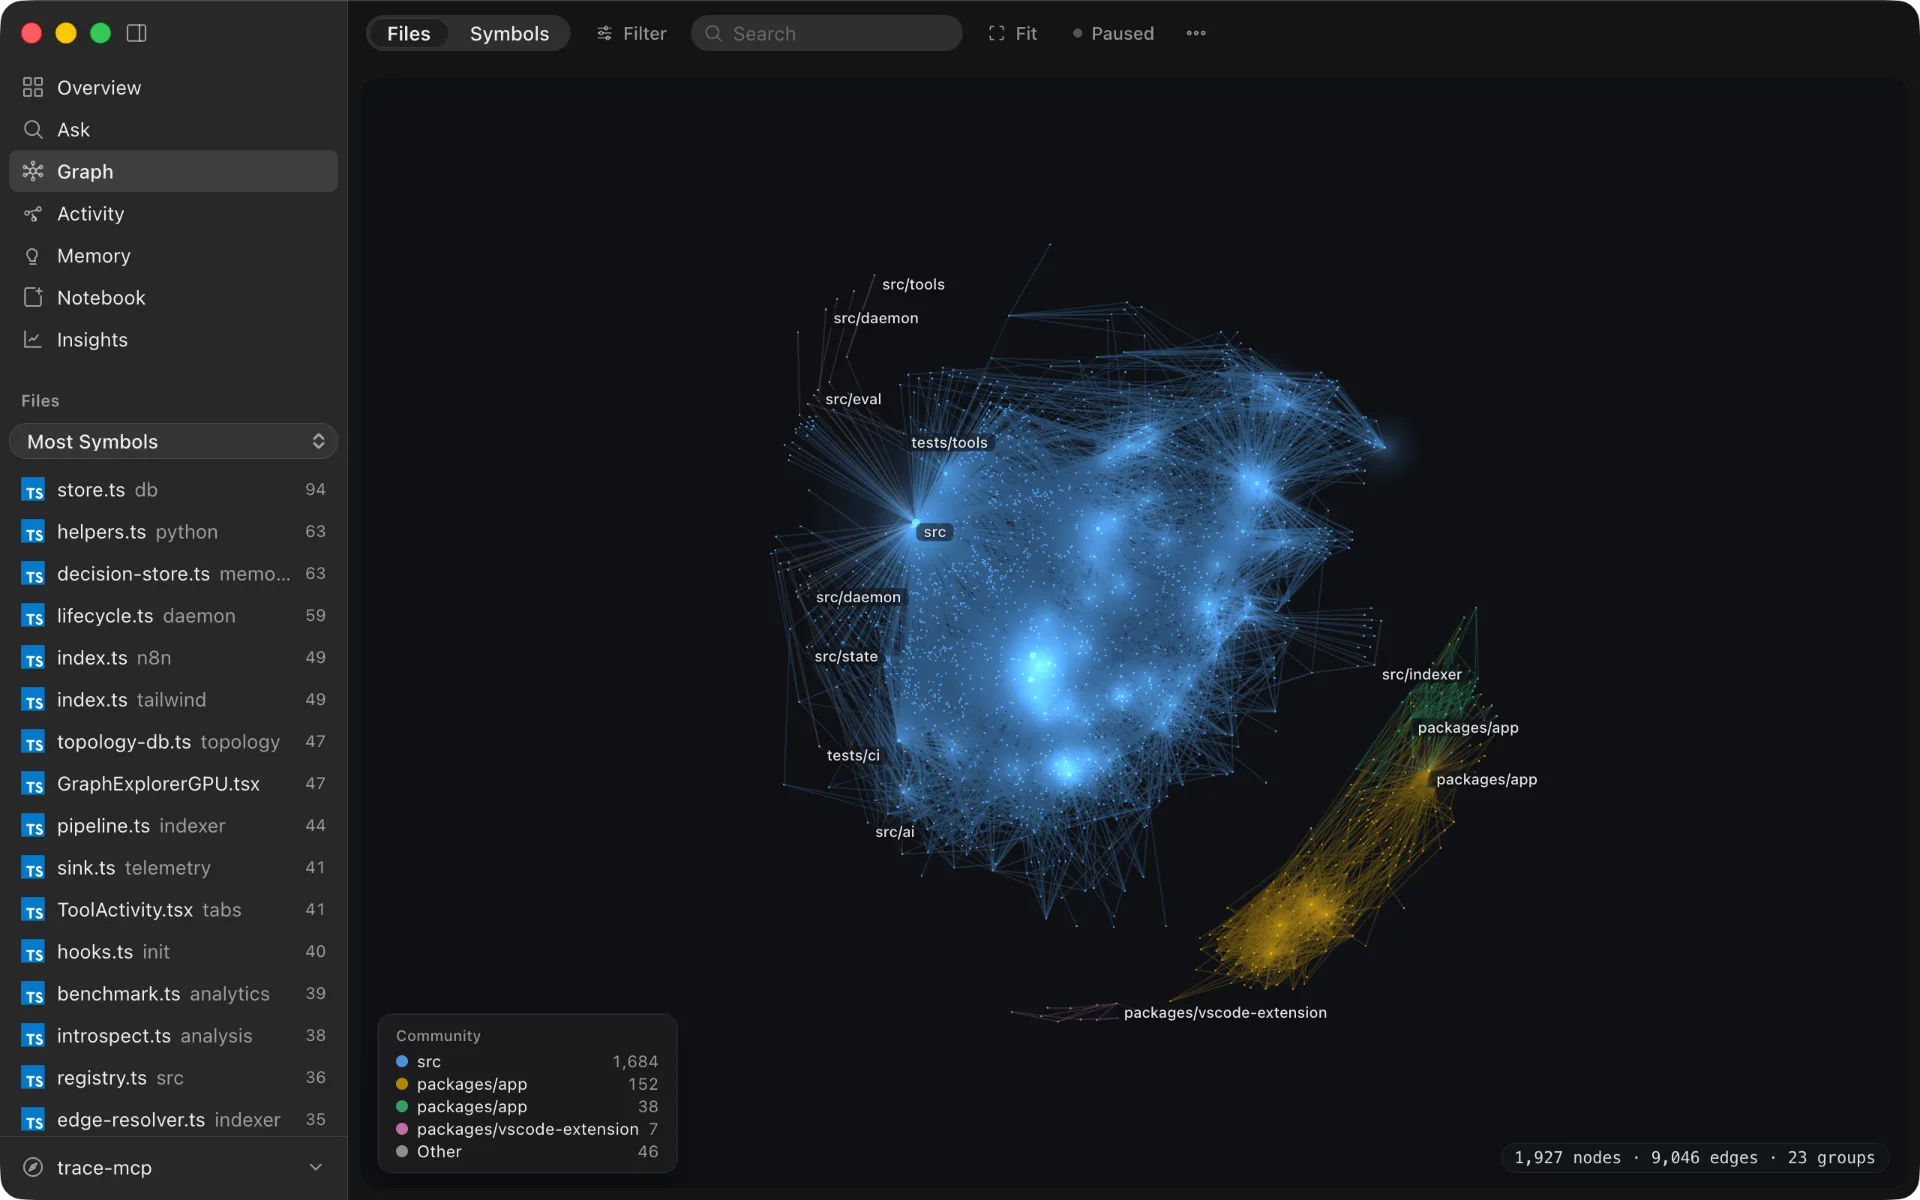
The desktop app: a GPU graph explorer over the same index the MCP server serves.
The problem
AI agents pay repeatedly for work they have already done. Every turn, the agent re-reads the same files, re-traverses the same dependencies, and re-inflates the context window with structure it discovered five steps ago. That repeated work is most of what a long session costs in tokens and latency.
trace-mcp builds a framework-aware graph of your codebase once, then serves it through MCP so the agent reasons from a precomputed structure instead of brute-reading the repo. Ask "what breaks if I change this model?" — instead of 80 Grep calls and 190 file reads, the agent calls get_change_impact once and gets the blast radius across PHP, Vue, migrations, and DI. 88 framework integrations across 81 languages, 182 tools.
The binding constraint is recomputation, not model capability: token bills, latency, and hallucinations all grow with project size instead of with task complexity. trace-mcp closes the recomputation leak. The graph is built once, kept incrementally fresh, and served to every agent that asks — so the same work isn't paid for over and over.
- Lower cost — fewer tokens per successful answer, on average and at peak
- Lower latency — fewer sequential tool calls, fewer round-trips to the model
- Higher accuracy — less noise in context means fewer hallucinations and stronger first-response correctness
- Production stability — context growth tracks task complexity rather than repository size
We started with code intelligence, where the repetition is most expensive, and the same engine now indexes markdown knowledge vaults (Obsidian, Logseq, plain MD) as a peer domain. Wikilinks, tags, frontmatter, and embeds become graph edges and symbol metadata; search, find_usages, get_change_impact, and apply_rename work identically over both.
What trace-mcp does for you
| You ask | trace-mcp answers | How |
|---|
| "What breaks if I change this model?" | Blast radius across languages + risk score + linked architectural decisions | get_change_impact — reverse dependency graph + decision memory |
| "Why was auth implemented this way?" | The actual decision record with reasoning and tradeoffs | query_decisions — searches the decision knowledge graph linked to code |
| "I'm starting a new task" | Optimal code subgraph + relevant past decisions + dead-end warnings | plan_turn — opening-move router with decision enrichment |
| "What did we discuss about GraphQL last month?" | Verbatim conversation fragments with file references | search_sessions — FTS5 search across all past session content |
| "Show me the request flow from URL to rendered page" | Route → Middleware → Controller → Service → View with prop mapping | get_request_flow — framework-aware edge traversal |
| "Find all untested code in this module" | Symbols classified as "unreached" or "imported but never called in tests" | get_untested_symbols — test-to-source mapping |
| "What's the impact of this API change on other services?" | Cross-subproject client calls with confidence scores | get_subproject_impact — topology graph traversal |
| "What notes link to this concept?" | Backlinks across the vault, with section + alias context | find_usages on a note:<basename> symbol |
| "What breaks if I rename this note?" | Every [[wikilink]] and [text](path.md) that references it | get_change_impact — wikilink-aware reverse graph |
Four capabilities that are rare among adjacent tools:
-
Framework-aware edges — trace-mcp understands that Inertia::render('Users/Show') connects PHP to Vue, that @Injectable() creates a DI dependency, that $user->posts() means a posts table from migrations. 88 framework integrations.
-
Code-linked decision memory — when you record "chose PostgreSQL for JSONB support", it's linked to src/db/connection.ts::Pool#class. When someone runs get_change_impact on that symbol, they see the decision. MemPalace stores decisions as text; trace-mcp ties them to the dependency graph.
-
Cross-session intelligence — past sessions are mined for decisions and indexed for search. When you start a new session, get_wake_up gives you orientation in ~300 tokens; plan_turn shows relevant past decisions for your task; get_wake_up { scope: "resume" } carries over structural context from previous sessions.
-
Code and knowledge in one graph — point trace-mcp at a markdown vault (Obsidian, Logseq, plain MD) and the same engine indexes it: each note becomes a note:<basename> symbol, headings become nested sections, [[wikilinks]] and ![[embeds]] become graph edges, frontmatter and #tags ride on metadata. PageRank, Signal Fusion ranking, embeddings, and rename refactoring all apply unchanged. The agent does not learn a second tool: it is the same graph, holding both the codebase and the notes.
Why agents keep re-reading
AI coding agents recompute the same work every turn — and they're framework-blind while doing it.
They re-read UserController.php, then re-read it again next turn. They don't know that Inertia::render('Users/Show', $data) connects a Laravel controller to resources/js/Pages/Users/Show.vue. They don't know that $user->posts() means the posts table defined three migrations ago. They can't trace a request from URL to rendered pixel — so they trace it again, and again, every session.
The result: 5–15× repeated reads of hot files in a single task, context windows used as scratch databases, and agents that get more expensive the bigger the project gets — instead of more capable.
The solution
trace-mcp builds a cross-language dependency graph from your source code and exposes it through the Model Context Protocol — the plugin format Claude Code, Cursor, Windsurf and other AI coding agents speak. Any MCP-compatible agent gets framework-level understanding out of the box.
| Without trace-mcp | With trace-mcp |
|---|
| Agent reads 15 files to understand a feature | get_task_context — optimal code subgraph in one shot |
| Agent doesn't know which Vue page a controller renders | routes_to → renders_component → uses_prop edges |
| "What breaks if I change this model?" — agent guesses | get_change_impact traverses reverse dependencies across languages |
| Schema? Agent needs a running database | Migrations parsed — schema reconstructed from code |
| Prop mismatch between PHP and Vue? Discovered in production | Detected at index time — PHP data vs. defineProps |
Desktop app
trace-mcp ships with an optional Electron desktop app (packages/app) that gives you a visual surface over the same index the MCP server uses. It manages multiple projects, wires up MCP clients, and provides a GPU-accelerated graph explorer — all without opening a terminal.
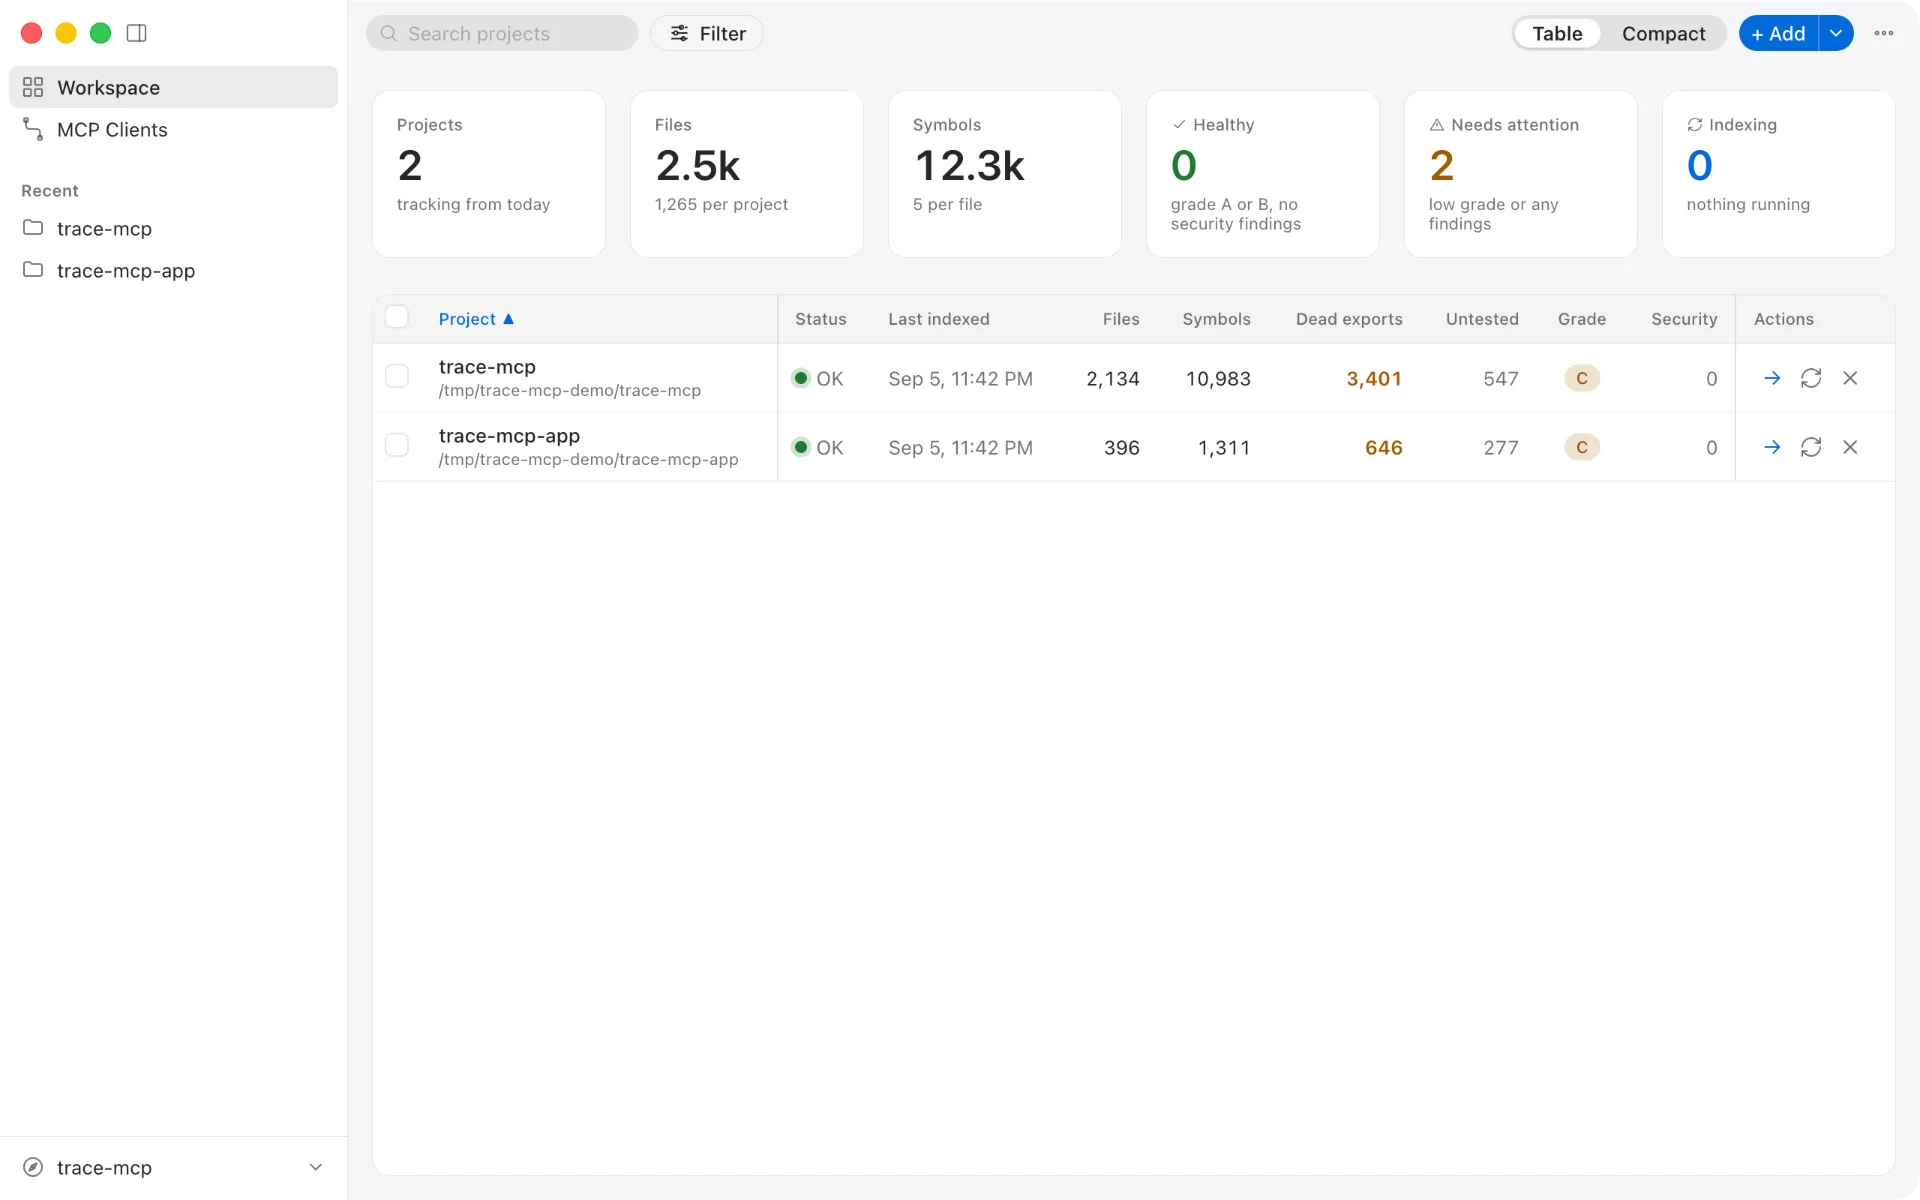
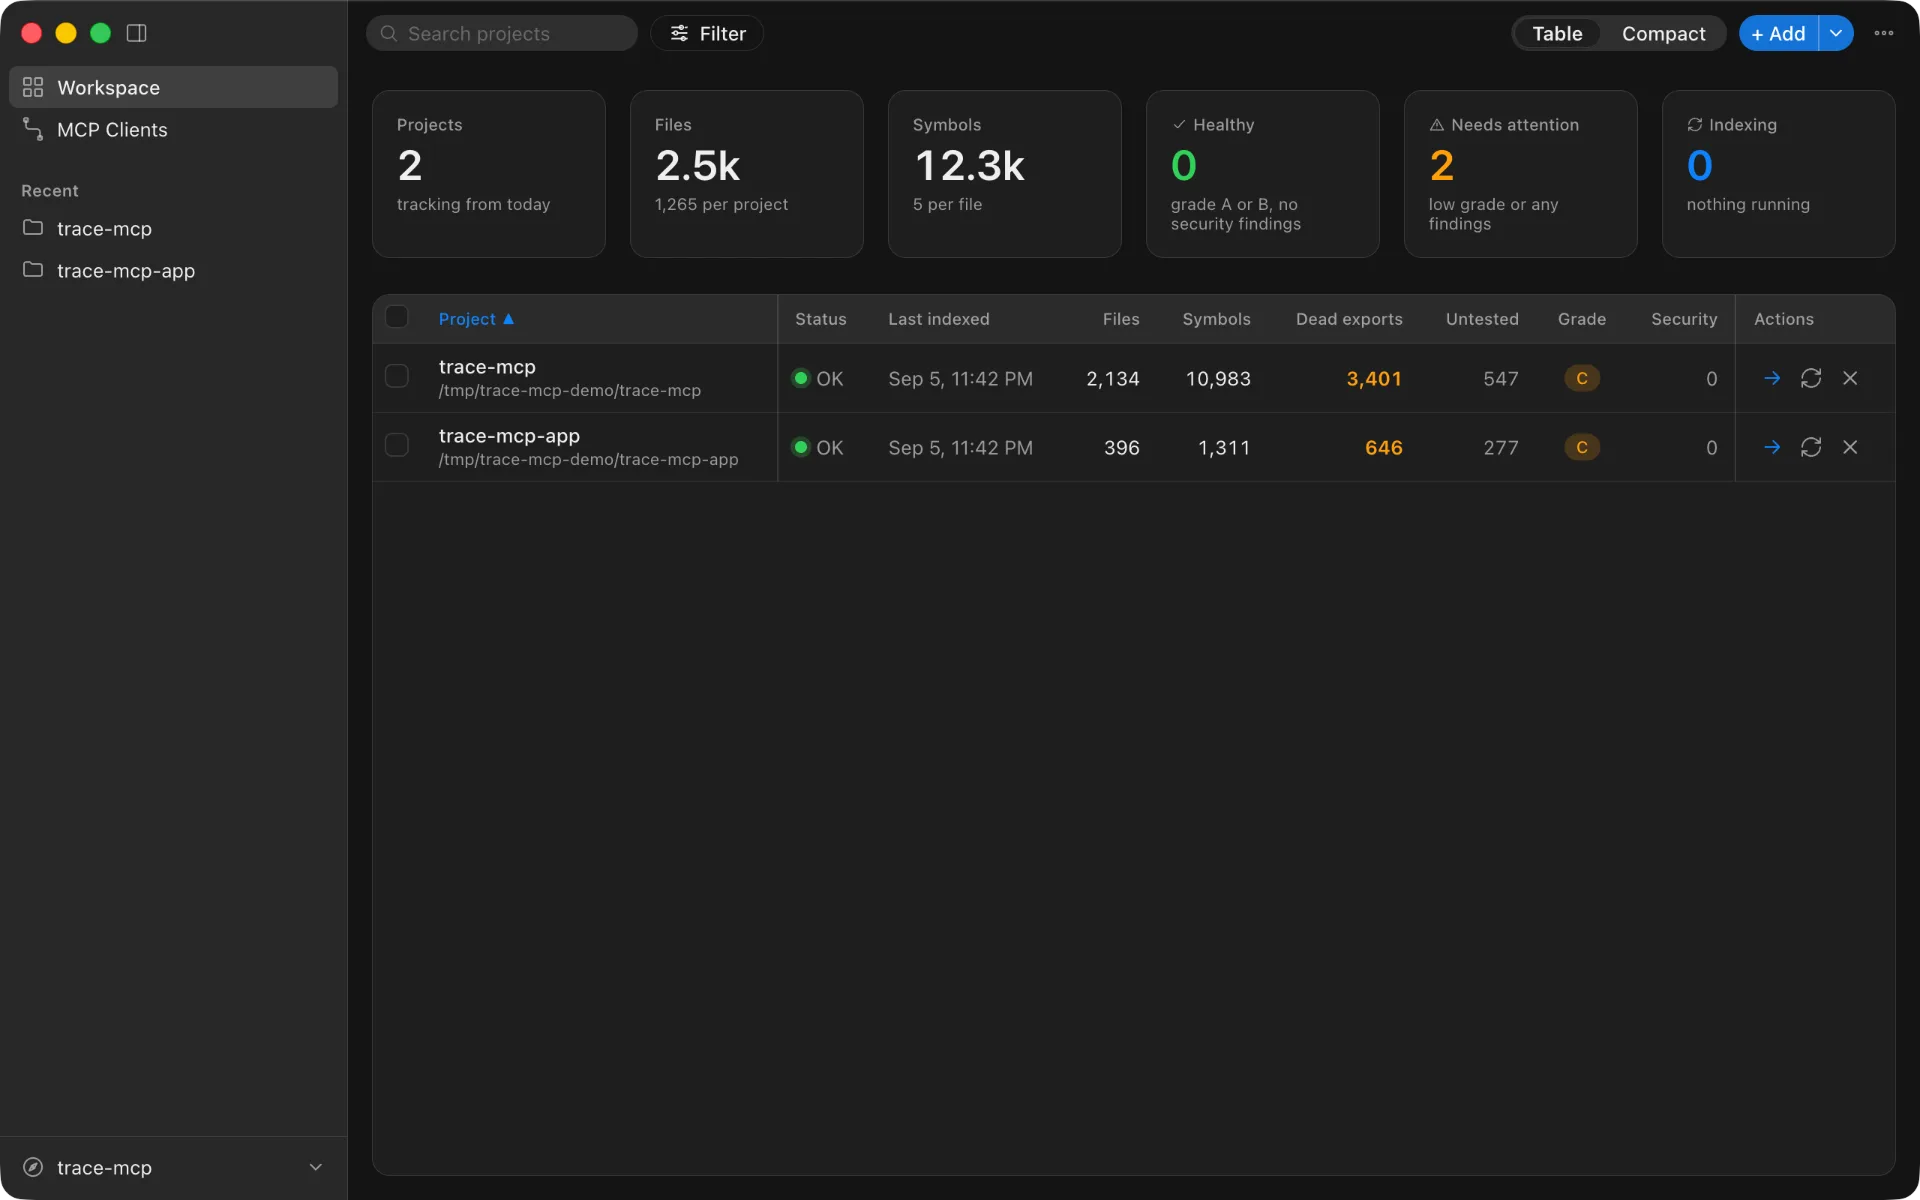
Projects & clients. The menu window lists indexed projects with live status (Ready / indexing / error) and re-index / remove controls. The MCP Clients tab detects installed clients (Claude Code, Claw Code, Claude Desktop, Cursor, Windsurf, Continue, Junie, JetBrains AI, Codex, AMP, Warp, Factory Droid) and wires trace-mcp into them with one click, including enforcement level (Base / Standard / Max — CLAUDE.md only, + hooks, + tweakcc & agent-behavior rules; Max-tier features are Claude Code–specific). Warp and JetBrains AI require manual paste in the IDE because their config storage is GUI-only.
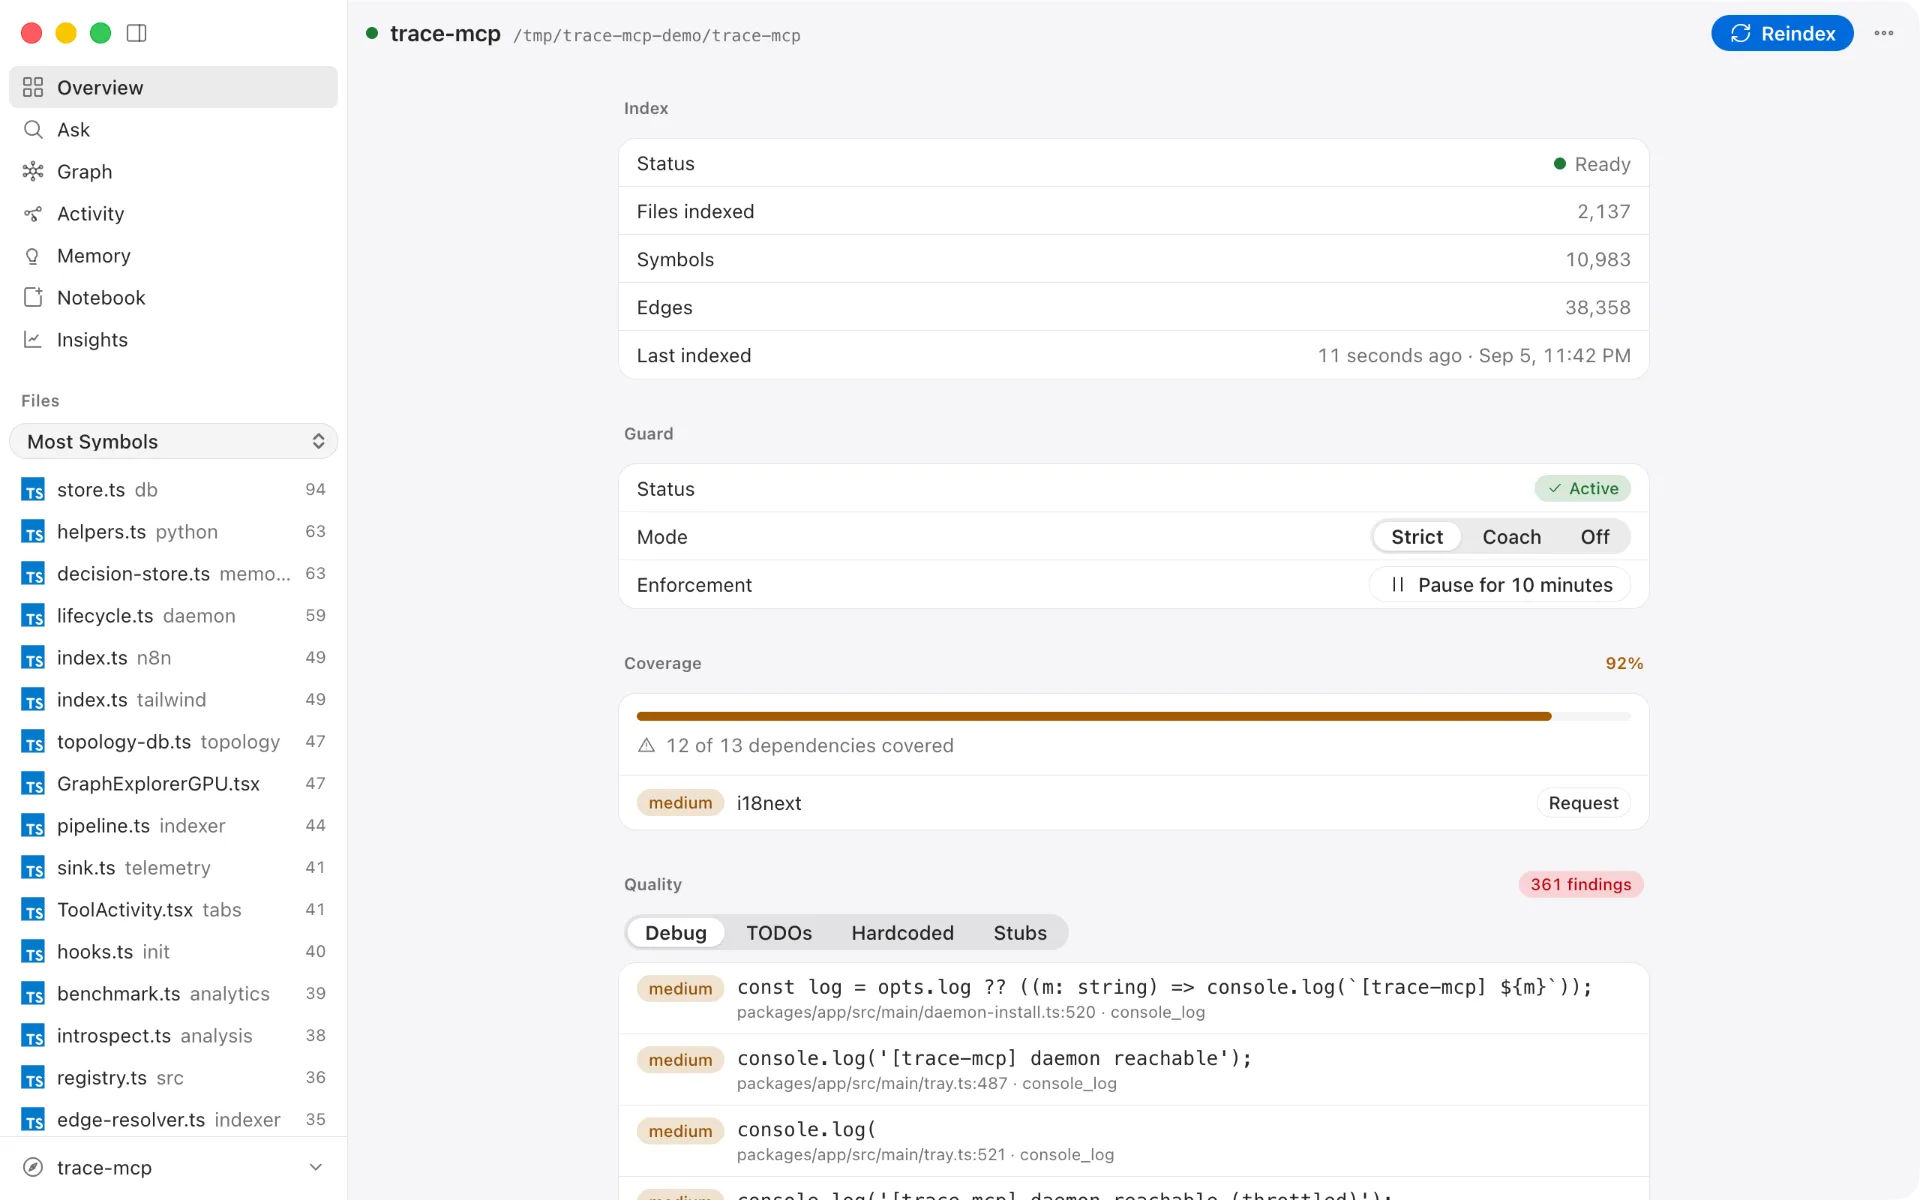
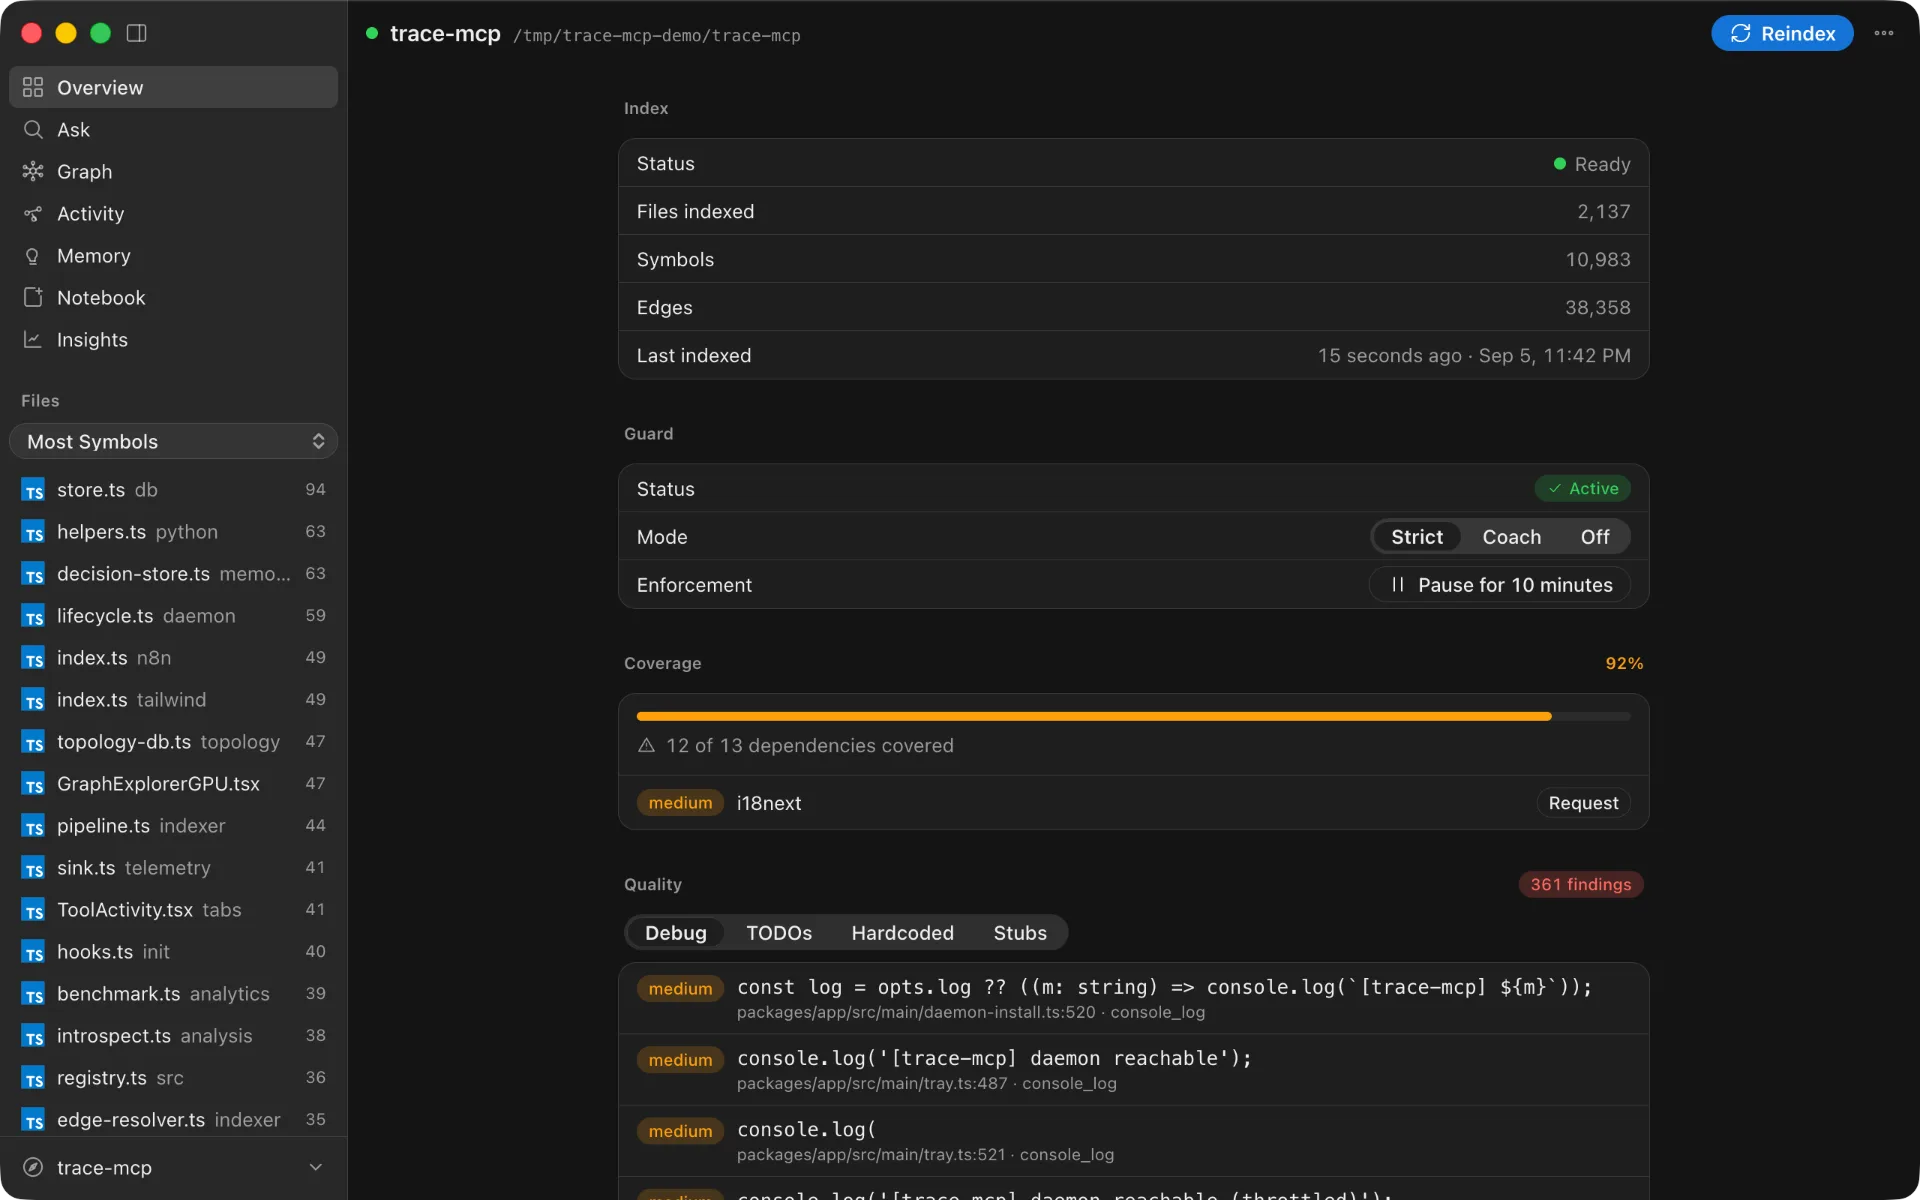
Per-project overview. Each project opens in its own tabbed window: Overview (files, symbols, edges, coverage, linked services, re-index), Ask (natural-language query over the index), and Graph. Overview also surfaces Most Symbols files, last-indexed timestamp, and the dependency coverage meter.
GPU graph explorer. The Graph tab renders the full dependency graph on the GPU via cosmos.gl — tens of thousands of nodes/edges at interactive frame rates. Filter by Files / Symbols, overlay detected communities, highlight groups, toggle labels/FPS, and step through graph depth. Good for getting a feel for coupling, hotspots, and how a codebase is actually shaped before you dive into tools.
Install on macOS: Download the .dmg — open it and drag trace-mcp to Applications. The button on the site picks Apple Silicon or Intel for you; if you would rather choose yourself, both builds are on the Releases page. The app is signed with a Developer ID and notarized by Apple, so it opens without a warning — if macOS ever does warn you about a trace-mcp build, that warning is real and the download should not be trusted.
Install on Windows: run trace-mcp.Setup.<version>.exe from Releases.
In-app updater stuck on an old build? App versions 3.10.0 and earlier on macOS/Windows can't update themselves — "Check for updates…" shows Cannot set properties of undefined (setting 'autoDownload') and does nothing, a bug fixed in 3.11.0 that the affected builds can't fetch their own way out of. Reinstall by hand: download the .dmg (macOS) or grab the latest trace-mcp.Setup.<version>.exe from Releases (Windows) — or, if you have the CLI installed, run trace-mcp install-app.
The app talks to the same trace-mcp daemon (http://127.0.0.1:3741) that MCP clients use, so anything you index from the app is immediately available to Claude Code / Cursor / etc. If you only want the MCP server and the CLI, you do not need the app at all — npm install -g trace-mcp is the whole install.
How trace-mcp compares
trace-mcp combines code graph navigation, cross-session memory, and real-time code understanding in a single tool. Most adjacent projects solve one of these — trace-mcp unifies all three and is the only one with framework-aware cross-language edges (88 framework integrations) and code-linked decision memory.
- vs. token-efficient exploration (Repomix, jCodeMunch, cymbal) — trace-mcp adds framework edges, refactoring, security, and subprojects on top of symbol lookup.
- vs. session-memory tools (MemPalace, claude-mem, ConPort) — trace-mcp links decisions to specific symbols/files, so they surface automatically in impact analysis.
- vs. RAG / doc-gen (DeepContext, smart-coding-mcp) — trace-mcp answers "show me the execution path, deps, and tests," not "find code similar to this query."
- vs. code-graph MCP servers (Serena, Roam-Code) — trace-mcp has the broadest language coverage (81 languages) and is the only one with cross-language framework edges.
Full side-by-side tables with GitHub stars, languages, and per-capability coverage: trace-mcp vs. other code intelligence MCP servers.
Head-to-head: vs Repomix · vs Serena · vs codegraph · vs codebase-memory-mcp · vs Claude Code context mode · vs code-review-graph · Repomix vs codegraph.
Token reduction — what we measured
AI agents burn tokens recomputing what they already discovered last turn — re-reading files, re-traversing dependencies, re-inflating context. trace-mcp replaces that with precision context: only the symbols, edges, and signatures relevant to the query, served from a graph that was computed once.
Start with the measurement that isn't ours. Everything else in this section is trace-mcp measured on trace-mcp's own repository — the first table row against real responses, everything below it by trace-mcp's own synthetic estimators. The PR review context benchmark is the exception: assembling review context for 60 merged pull requests across six open-source repositories — hono, axios, express, requests, flask, got — cost a median 3,291 input tokens against 13,595 for loading the diff plus every file it touches, 72.7% less, counted with gpt-tokenizer rather than estimated. The base and head SHAs are pinned in benchmarks/pr-context/dataset.json, npx tsx scripts/bench-pr-context.ts re-runs it, and the 56 pull requests where the index did not pay off are published alongside the wins — 13 that cost more than reading the files outright, and 42 where the bundle's token budget did not deliver every changed symbol's body, a shortfall the benchmark could not see until this run made it score delivery rather than listing.
What to expect — by workload:
| Workload | Typical reduction |
|---|
| Mixed real-world production (measured tool responses vs. the file reads they replace) | 68% fewer tokens |
| Structured code-navigation tasks (symbol lookup, impact analysis, type hierarchy, call graph) | up to 99% less redundant processing — synthetic estimate |
| Targeted research / planning queries (composite tasks that replace ~10 sequential operations) | up to ~40× on individual calls — synthetic estimate |
| Non-code workloads (raw text, unstructured data) | Out of scope today |
The 68% is the honest number to plan against, and the reason it moved is not that the product got faster. We used to print "~40–50% on average". That figure descended from a counter that scored each call before the tool ran — RAW_COST_ESTIMATES[tool] × 0.15, a constant with no variance — which we found and fixed ourselves in #915. The honest replacements read 29.3%, then 21.1%, then 21.0% as coverage grew to 97.2% of recorded calls. Then we found that three tools carrying 76% of the weight were each priced from one sample, and that four defensible ways of choosing those samples price the same build at 21.0%, 30.7%, 56.0% and 67.4%. So the sampling frame is now generated, frozen and committed before the run that uses it, with every claim about how it was built re-checked against the repository in CI (preregistration). 68% is what the registered frame measures; read the jump from 21% as a change of frame, not a change of product. It weights real o200k_base counts of real responses by 18,329 recorded calls from one machine (per-tool table, generated into docs/_data/response_tokens.json). Three caveats travel with it: the baseline half — what a Read/Grep would have cost instead — is still a hand-written estimate; five of the twenty-three tools measured return more tokens than they replace, and the old counter booked a saving for them anyway; and two more tools (register_edit, reindex) replace no file read at all, so they are now credited zero and counted as overhead — with them on the spend side the all-in figure is 67%. The peaks below (up to 99% on individual structured calls) are a synthetic estimate, per-call, not