

koala73/worldmonitorConnectors
Real-time global intelligence dashboard. AI-powered news aggregation, geopolitical monitoring, and infrastructure tracking in a unified situational awareness interface
86k
Opik MCP Server plugs an AI host into an Opik workspace so the agent can read traces, log scores, save prompt versions, and manage diagnostics. It works through MCP tools like `read`, `list`, `write`, and `schema`, and the README gives setup paths for Claude Code, Cursor, VS Code Copilot, Codex, and any MCP client.
Builders who already run Opik and want to use the same agent they code with to inspect and update observability data.
You can check traces, add scores, and manage prompts without leaving your chat tool.
Provides `read` and `list` tools for projects, traces, spans, prompts, threads, test suites, experiments, and diagnostics issues.
Supports `trace.create`, `span.create`, `score.create`, `comment.create`, and `prompt_version.save` through one dispatcher.
Can enable, trigger, resolve, close, and reopen Opik Diagnostics jobs and issues from the agent.
Includes config examples for Claude Code, Cursor, VS Code Copilot, and other MCP clients, plus a hosted cloud endpoint.
The `schema` tool shows the exact JSON shape for write operations and list filters before the agent calls them.
uvx opik mcp configure
npx add-mcp https://www.comet.com/opik/api/v1/mcp --name opik-mcp
curl -LsSf https://astral.sh/uv/install.sh | sh   # macOS / Linux
# or: brew install uv
claude mcp add --transport stdio opik-mcp \
  --env OPIK_API_KEY=<your-key> \
  --env OPIK_WORKSPACE=<your-workspace> \
  -- uvx opik-mcp
OPIK_API_KEY=<your-key> OPIK_WORKSPACE=<your-workspace> \
  npx @modelcontextprotocol/inspector uvx opik-mcp
The official Model Context Protocol (MCP) server for Opik, the open-source LLM observability and evaluation platform, built by Comet. Plug your AI host (Claude Code, Cursor, VS Code Copilot, Codex, opencode, or any MCP client) directly into your Opik workspace: read traces, log scores, and save prompt versions, all from the chat.
Built for LLM engineers who already run Opik and want to drive it from the same AI assistant they code with.
Migrating from the old
npx opik-mcp? The TypeScript server is deprecated and sunsets on 2026-11-15. Swapnpx -y opik-mcpforuvx opik-mcp@latestin your MCP client config. Full guide:legacy/typescript/MIGRATION.md.
You:    "Which traces in project 'demo' failed today?"
Claude: → list(entity_type="trace", project_name="demo") → "Three traces failed…"

You:    "Score trace 7f2e… 0.9 on helpfulness with reason 'great recovery'."
Claude: → write(score.create) → done
One command registers the server with the AI clients on your machine, installs
the Opik skill pack, and verifies the connection. It needs uv
and no Opik SDK:
uvx opik mcp configure
It detects Claude Code, Cursor, VS Code Copilot, Codex and opencode, and uses the hosted server on Opik Cloud (browser sign-in, no API key stored) or this local server elsewhere. Any other MCP client can take the hosted URL directly:
npx add-mcp https://www.comet.com/opik/api/v1/mcp --name opik-mcp

Setup guide, troubleshooting and FAQ: comet.com/docs/opik/mcp-server. The rest of this README covers the local server, which the command above sets up for self-hosted and open-source Opik, and which you can also configure by hand.
opik-mcp is a Python package (requires Python 3.13+). The recommended way to
run it is uvx, which fetches and runs the latest published version on demand —
no global install, no virtualenv juggling.
Install uv once:
curl -LsSf https://astral.sh/uv/install.sh | sh   # macOS / Linux
# or: brew install uv
You'll need two things from your Opik workspace:
OPIK_API_KEY — get it from comet.com/api/my/settings/.OPIK_WORKSPACE — your workspace name (lowercase, as it appears in the URL). E.g. https://www.comet.com/acme-ai/... → OPIK_WORKSPACE=acme-ai. COMET_WORKSPACE is accepted as a deprecated alias.Cloud, with an API key: set it unless your account default is the one you want. Left out, the server sends
default, which Comet resolves to your account's default workspace. That works, but if you actually work in a named workspace you will be pointed at a different one with nothing to tell you — your reads come back from the wrong place rather than failing.Cloud, over OAuth: leave it unset. The workspace comes from the token you authorized, and the server ignores this setting entirely.
Local / open source: leave it unset. Open source Opik has a single workspace named
defaultand no way to create others, which is exactly what the fallback gives you.Self-hosted Comet: set it. Unlike open source, these deployments have real named workspaces, and the same silent-wrong-workspace risk applies.
Whichever applies, make sure the value is actually substituted. Snippets in the wild ship placeholders like
<your-workspace>or${input:OPIK_WORKSPACE}; pasted as-is, those are not workspace names. The server now refuses them outright rather than letting the backend answer with an auth error that explains nothing.
Add the server with one command:
claude mcp add --transport stdio opik-mcp \
  --env OPIK_API_KEY=<your-key> \
  --env OPIK_WORKSPACE=<your-workspace> \
  -- uvx opik-mcp
Or edit ~/.claude.json directly:
{
  "mcpServers": {
    "opik-mcp": {
      "type": "stdio",
      "command": "uvx",
      "args": ["opik-mcp"],
      "env": {
        "OPIK_API_KEY": "<your-key>",
        "OPIK_WORKSPACE": "<your-workspace>"
      }
    }
  }
}
Restart Claude Code. Verify with /mcp — opik-mcp should appear as connected.
Then, in the chat, ask: "list my Opik projects" — Claude will call the list
tool and you'll see your workspace's projects.
Edit ~/.cursor/mcp.json (global) or .cursor/mcp.json (project), or open
Cmd+Shift+J → Features → Model Context Protocol:
{
  "mcpServers": {
    "opik-mcp": {
      "type": "stdio",
      "command": "uvx",
      "args": ["opik-mcp"],
      "env": {
        "OPIK_API_KEY": "<your-key>",
        "OPIK_WORKSPACE": "<your-workspace>"
      }
    }
  }
}
Reload Cursor; the green dot next to opik-mcp in the MCP panel confirms the
connection. Ask in chat: "list my Opik projects".
Cursor 60s timeout. Cursor enforces a hard tool-call timeout that doesn't reset on progress notifications. See Known host limits.
.vscode/mcp.json in your workspace (or User Settings JSON):
{
  "servers": {
    "opik-mcp": {
      "type": "stdio",
      "command": "uvx",
      "args": ["opik-mcp"],
      "env": {
        "OPIK_API_KEY": "<your-key>",
        "OPIK_WORKSPACE": "<your-workspace>"
      }
    }
  }
}
Reload the window; the Copilot Chat MCP indicator shows opik-mcp once
the server is reachable. Ask in chat: "list my Opik projects".
OPIK_API_KEY=<your-key> OPIK_WORKSPACE=<your-workspace> \
  npx @modelcontextprotocol/inspector uvx opik-mcp
Add COMET_URL_OVERRIDE (and OPIK_URL if Opik lives at a non-default path) to
the same env block in your host config:
{
  "mcpServers": {
    "opik-mcp": {
      "type": "stdio",
      "command": "uvx",
      "args": ["opik-mcp"],
      "env": {
        "OPIK_API_KEY": "<your-key>",
        "OPIK_WORKSPACE": "<your-workspace>",
        "COMET_URL_OVERRIDE": "https://opik.your-company.com",
        "OPIK_MCP_ANALYTICS_SOURCE": ""
      }
    }
  }
}
Omit OPIK_WORKSPACE on an open-source deployment, where default is the only
workspace; keep it on a self-hosted Comet, which has real named ones.
Setting OPIK_MCP_ANALYTICS_SOURCE="" opts your install out of the
cloud-Comet source label on telemetry events.
opik-mcp exposes a small, outcome-oriented surface that covers the full
lifecycle (read → annotate → curate → author → iterate).
| Tool | Purpose |
|---|---|
read | Universal read by id / name / opik:// URI |
list | Universal list with optional name filter + pagination |
write | Universal write — log traces/spans, score, comment, save prompts, manage test suites & experiments |
schema | Introspect write-operation schemas (used by the LLM to construct valid payloads) |
read_skill | Read one of the Opik agent skills bundled with this server |
readOne tool for any "show me X" question. Takes an entity_type plus an id
(UUID or, for nameable types, a name) or a full opik:// URI. Composite reads
(trace, prompt, thread, agent_insights_issue) inline their children so
a single call returns the full picture.
Supported entities: project, trace, span, test_suite, experiment,
prompt, thread, agent_insights_issue. Name-based lookup is available for
project, experiment, prompt, test_suite (slower — two API calls — and
may return multiple matches). thread and agent_insights_issue are
project-scoped: pass project_id or project_name, or a link/URI that carries
the project.
read(entity_type="trace", id="7f2e3c8a-…")
read(entity_type="project", id="demo")          # name lookup
read(entity_type="trace", id="opik://traces/7f2e3c8a-…")
read(entity_type="agent_insights_issue", id="<issue-uuid>", project_id="<project-uuid>")
read(entity_type="agent_insights_issue", id="https://www.comet.com/opik/<ws>/projects/<pid>/diagnostics?issue=<id>")
A link copied from the Opik UI works as the id: a thread link or a
Diagnostics page link carries the project, so no project_id is needed and
the entity type is taken from the link.
An agent_insights_issue read returns {issue, example_trace_ids, details}:
the Diagnostics issue record (name, description, cause, suggested fix,
severity, status), the deduplicated ids of the traces that exhibit it (the
same sample the Diagnostics page shows — open one with read("trace", id)),
and the per-day breakdown. Trace bodies are not inlined, so the read stays one
backend call. since / until narrow the per-day rows; the default is
all-time. When the server knows the Opik URL and the session's workspace, the
read also carries url (the issue's Diagnostics page) and trace_url_template
(a deep link for any of the example traces), so the assistant can hand you
something clickable; under an OAuth session whose workspace could not be
resolved the links are omitted rather than guessed.
Traces themselves carry no URL — a link for one is not derivable from the
fields a read or list returns, and a guessed shape 404s. The session
instructions name a template for it instead,
.../v1/session/redirect/projects/?trace_id={trace_id}&path=..., so the
assistant fills in an id and hands you a link. It goes through opik-backend's
redirect, which resolves the project and the workspace from the trace, so it
works where a direct project URL cannot, an OAuth session with an unresolved
workspace included. It is the same link the Python SDK prints for a trace.
listBrowse or search a collection with pagination. Project-scoped types (trace,
span, thread, agent_insights_issue, test_suite_item, prompt_version)
need their parent: a project UUID or name, a suite UUID, or a prompt UUID.
list(entity_type="experiment", page=1, size=25)
list(entity_type="experiment", name="rerank")          # name substring filter
list(entity_type="agent_insights_issue", project_name="demo")             # open Diagnostics issues
list(entity_type="agent_insights_issue", project_id="<uuid>", status="resolved")
list(entity_type="trace", project_name="demo")         # latest traces of one project
list(entity_type="trace", project_name="demo",
     filters='error_info is_not_empty AND duration > 5000')
list(entity_type="span", project_name="demo",          # spans across the whole project
     filters='type = "llm" AND usage.total_tokens > 10000')
list(entity_type="thread", project_name="demo",
     filters='number_of_messages > 20 AND feedback_scores.helpfulness < 0.5')
list(entity_type="experiment",
     filters='dataset_id = "<dataset-uuid>" AND tags contains "baseline"')
Filters. trace, span, thread and experiment take an OQL string, the
same grammar as the SDK's search_traces(filter_string=…):
<field>[.<key>] <op> <value> [AND ...]
ops: = != > >= < <= contains not_contains starts_with ends_with is_empty is_not_empty in not_in
Strings go in double quotes, numbers are bare, duration is in milliseconds,
dates are ISO-8601 instants with a timezone ("2026-09-08T10:00:00Z").
Scores and dictionaries take a key: feedback_scores.accuracy < 0.5,
metadata.environment = "prod". AND is the only connector.
Like the UI's Logs page, trace, span and thread lists add source = "sdk" so
evaluator, playground and experiment traces stay out of the way; name source
yourself to see them. The first output line echoes the filter that was applied.
A bad filter fails before reaching the backend with what is needed to fix it:
the position of a syntax error, the closest field name, the valid operators for
the field's type, or the expected value format. Fields with a closed set of
values (source, span type, thread status, visibility_mode) are checked
against it too, every element of an in list included. source is the one the
backend validates itself, and it answers an unknown value with a 500 rather
than a 400, so source = "SDK" would otherwise be an opaque server error for a
capital letter. The rest are compared as strings and answer with an empty page,
which reads as "no matches" when it means "no such value". Ask
schema("list.trace") (or list.span, list.thread, list.experiment) for
the full field reference, accepted values included.
Sort. The same four types take sort="<field> [asc|desc]", desc by
default and one field only: sort="duration desc", sort="total_estimated_cost",
sort="feedback_scores.accuracy asc", sort="usage.total_tokens". The field is
checked against the entity's sortable list before the call, because the backend
silently ignores fields it cannot sort by. On very large workspaces the backend
drops sorting altogether; the header says so when that happens.
Time window and search. trace, span and thread take since and
until, each a relative span ("30m", "1h", "7d") or an ISO-8601 instant
with a timezone, so "the last hour" needs no clock arithmetic. The window is by
record creation time, which is cheap for the backend and agrees with
start_time within seconds for live traffic. For an exact bound, put
start_time in filters. The same three types take search, free text matched
anywhere in id, name, input, output, metadata, tags and thread id. Search scans
the whole project on the backend, so the first call on a large project can take
tens of seconds. Those calls get a 60-second timeout. Adding since makes them
fast again.
Reading the table. Durations are labelled duration_ms / ttft_ms and
shown as whole milliseconds; the field stays duration in filters and
sort. Timestamps are shown to the second and costs as plain decimals.
Project rows carry last_updated_trace_at so you can see which project has
live traffic; thread rows carry the first message. An empty page under a time
window says when the project's last trace landed, and an empty page under the
default source = "sdk" says how to see the other sources. A misspelled
project_name comes back with the closest existing name.
list(entity_type="trace", project_name="demo", since="1h",
     filters="error_info is_not_empty", sort="duration desc")
list(entity_type="trace", project_name="demo", search="order-42")
Diagnostics issues. agent_insights_issue is the Diagnostics page over
the MCP: the recurring failures Opik's Diagnostics job grouped for a project,
ranked as the UI ranks them (most recently seen first). Columns are severity,
status, total_occurrences (all-time sum), latest_count (the most recent
report day, the number the issue's own description refers to) and last_seen.
Open issues are listed by default; pass status="resolved" or "closed" for
the rest. read and list also answer to issue, which is what the UI calls
these; the long name is the one in the entity_type enum, so that one entity
does not appear there twice. Counts are all-time so they match the UI; the same since / until
as for traces narrow the window, truncated to UTC report days because
Diagnostics aggregates per day.
An empty list says why it is empty, because "nothing is broken" and "nobody turned Diagnostics on" read the same otherwise. There are five states: Diagnostics is unavailable on this deployment, not enabled for this project, turned off, enabled but not scanned recently, or enabled and clean with the time of the last scan. The ones you can act on name the call to make, and every state links the project's Diagnostics page.
A non-empty list dates itself. The issues are whatever the last scan grouped,
so the reply ends with Report covers data through <time>, and when the window
you asked about runs past that, it names the uncovered tail and how to close
it: a trigger when a rescan reaches back far enough, otherwise raw traces with
the since it gives you. Ask for a week on a project scanned nightly and the
last day is missing from the grouped answer; this is what says so.
write("agent_insights_job.enable", {"project_name": "demo"}) turns Diagnostics
on. It scans daily from then on, and calling it again is safe.
write("agent_insights_job.trigger", …) scans the last 24 hours now, without
waiting for the nightly run. Both take the permission that reading issues takes,
and both refuse where the deployment has no Diagnostics.
An issue moves through its lifecycle with
write("agent_insights_issue.resolve", {"issue_id": "<uuid>", "project_name": "demo"})
— dealt with — or …close for one not worth acting on, and …reopen to put
either back on the open list. All three take the same permission and answer
with a link to the view the issue moved to, since a resolved issue is no longer
on the default page. Whether a failure is fixed is a judgment call, so these
are for when you ask: the assistant has no business tidying the list while
triaging it.
writeUniversal write dispatcher. Pass operation + data and the dispatcher
validates the payload, applies the right REST verb, and returns the
backend response.
Operations:
| Operation | What it does |
|---|---|
trace.create | Log a single trace (or a batch). Parent for spans / scores / comments. |
trace.update | Finalize or amend an existing trace. |
span.create | Log a span on an existing trace (or a batch). |
score.create | Attach a numeric feedback score to a trace, span, or thread. |
comment.create | Attach a free-text comment to a trace, span, or thread. |
prompt_version.save | Save a new prompt version (creates the prompt by name if missing). |
test_suite.create | Create an evaluation test suite. |
test_suite_item.upsert | Upsert items into a test suite (always the envelope shape). |
experiment.create | Create an experiment scoped to a test suite. |
experiment_item.create | Attach trace + dataset_item rows to an experiment. |
agent_insights_job.enable | Turn Diagnostics on for a project (daily scans, safe to repeat). |
agent_insights_job.trigger | Run a Diagnostics scan now, over the last 24 hours. |
agent_insights_issue.resolve | Mark a Diagnostics issue dealt with (ask the user first). |
agent_insights_issue.close | Mark a Diagnostics issue not worth acting on (ask the user first). |
agent_insights_issue.reopen | Put a resolved or closed Diagnostics issue back on the open list. |
write(operation="score.create", data={
  "target": "trace",
  "target_id": "7f2e3c8a-…",
  "name": "helpfulness",
  "value": 0.9,
  "reason": "great recovery"
})
schemaInspect the exact JSON shape and required fields of any write operation before
you call it — useful when you're not sure what data should look like. Returns
the schema, OAuth scope, and one validated example. Pure lookup, no backend
call.
schema(operation="score.create")
schema(operation="prompt_version.save")
The same tool answers list.trace, list.span, list.thread and
list.experiment with the list tool's reference for that entity: every
filterable field with its type and valid operators, the sortable fields, whether
a time window and free-text search apply, and two example filters.
schema(operation="list.trace")
Every setting is an environment variable. Required ones in bold.
| Variable | Default | Notes |
|---|---|---|
OPIK_API_KEY | — | Required for any authenticated read/write. |
OPIK_WORKSPACE | unset | Workspace name. On cloud with an API key, unset sends default, which resolves to your account's default workspace — set it explicitly if you work in a different one, or reads come from the wrong workspace silently. Leave unset over OAuth (the token carries it) and on local/OSS (default is the only workspace there). |
COMET_WORKSPACE | — | Deprecated alias for OPIK_WORKSPACE (backward compat). OPIK_WORKSPACE wins if both are set. |
COMET_WORKSPACE_ID | unset | Optional workspace UUID. Stamped into analytics events when set, and takes precedence over the resolved one. Rarely needed — OAuth installs get the UUID from the token automatically. |
COMET_URL_OVERRIDE | https://www.comet.com | Set to your self-hosted Comet host, or https://dev.comet.com for staging. |
OPIK_URL | derived from COMET_URL_OVERRIDE + /opik/api | Override only if Opik lives on a different host/path than the Comet UI. |
OPIK_DEFAULT_PROJECT_NAME | unset | When set, the per-session instructions blob tells the LLM to pass this as project_name on every tool call unless the user names a different project. |
| Variable | Default | Notes |
|---|---|---|
OPIK_MCP_TRANSPORT | stdio | stdio for host-launched, streamable-http to listen on a port. |
OPIK_MCP_HOST | 127.0.0.1 | uvicorn bind host (streamable-http only). |
OPIK_MCP_PORT | 8080 | uvicorn bind port (streamable-http only). |
OPIK_MCP_RELOAD | false | true to enable uvicorn --reload (dev only). |
OPIK_MCP_AS_URL | unset | OAuth Authorization Server URL, advertised in /.well-known/oauth-protected-resource (RFC 9728) and used as the proxy target for AS-discovery probes. Required for MCP hosts to bootstrap the OAuth dance over HTTP. |
OPIK_MCP_RESOURCE_URI | unset | Canonical public URI of this server, advertised as resource in the protected-resource metadata and used to derive the WWW-Authenticate hint. |
OPIK_MCP_OAUTH_VALIDATION_CACHE_TTL_S | 30 | How long a "valid" answer from opik-backend's token introspection is trusted before the next request on the same OAuth token asks again. Bounds the backend load added by per-request validation and the window in which an expired token is still forwarded (that window also ends on the first 401 the backend returns). Capped by the token's own expires_at when the backend reports one. |
OPIK_MCP_LOG_LEVEL | INFO | stderr logger threshold. |
Two bearer shapes, two contracts on HTTP transport. An opik_mcp_at_… OAuth
access token is validated on every request against opik-backend's token
introspection endpoint (cached, see OPIK_MCP_OAUTH_VALIDATION_CACHE_TTL_S);
an expired or revoked token gets an HTTP 401 with
WWW-Authenticate: Bearer error="invalid_token", which is what MCP hosts key
their silent refresh_token grant on. An Opik API key is not validated
locally: it is forwarded verbatim to opik-backend, which is its single point
of enforcement. Pick the transport by deployment shape:
| Scenario | Transport |
|---|---|
| MCP client and Opik on the same machine (local OSS install) | stdio (recommended — simplest, no port, no OAuth setup) |
| Local MCP client → remote Opik (Comet cloud / self-hosted) | stdio with OPIK_API_KEY, or HTTP with OAuth (OPIK_MCP_AS_URL pointing at the backend) |
| Hosted opik-mcp behind the same edge as opik-backend | HTTP — bearers are validated by the backend per request |
Note for local OSS installs: the OSS backend does not authenticate requests,
so an HTTP opik-mcp in front of it is as open as the OSS REST API itself.
Keep the default 127.0.0.1 b
Sign in to join the discussion.
No comments yet. Be the first to say what this is good for.
Real-time global intelligence dashboard. AI-powered news aggregation, geopolitical monitoring, and infrastructure tracking in a unified situational awareness interface
High-performance code intelligence MCP server. Indexes codebases into a persistent knowledge graph — average repo in milliseconds. 158 languages, sub-ms queries, 99% fewer tokens. Single static binary, zero dependencies.
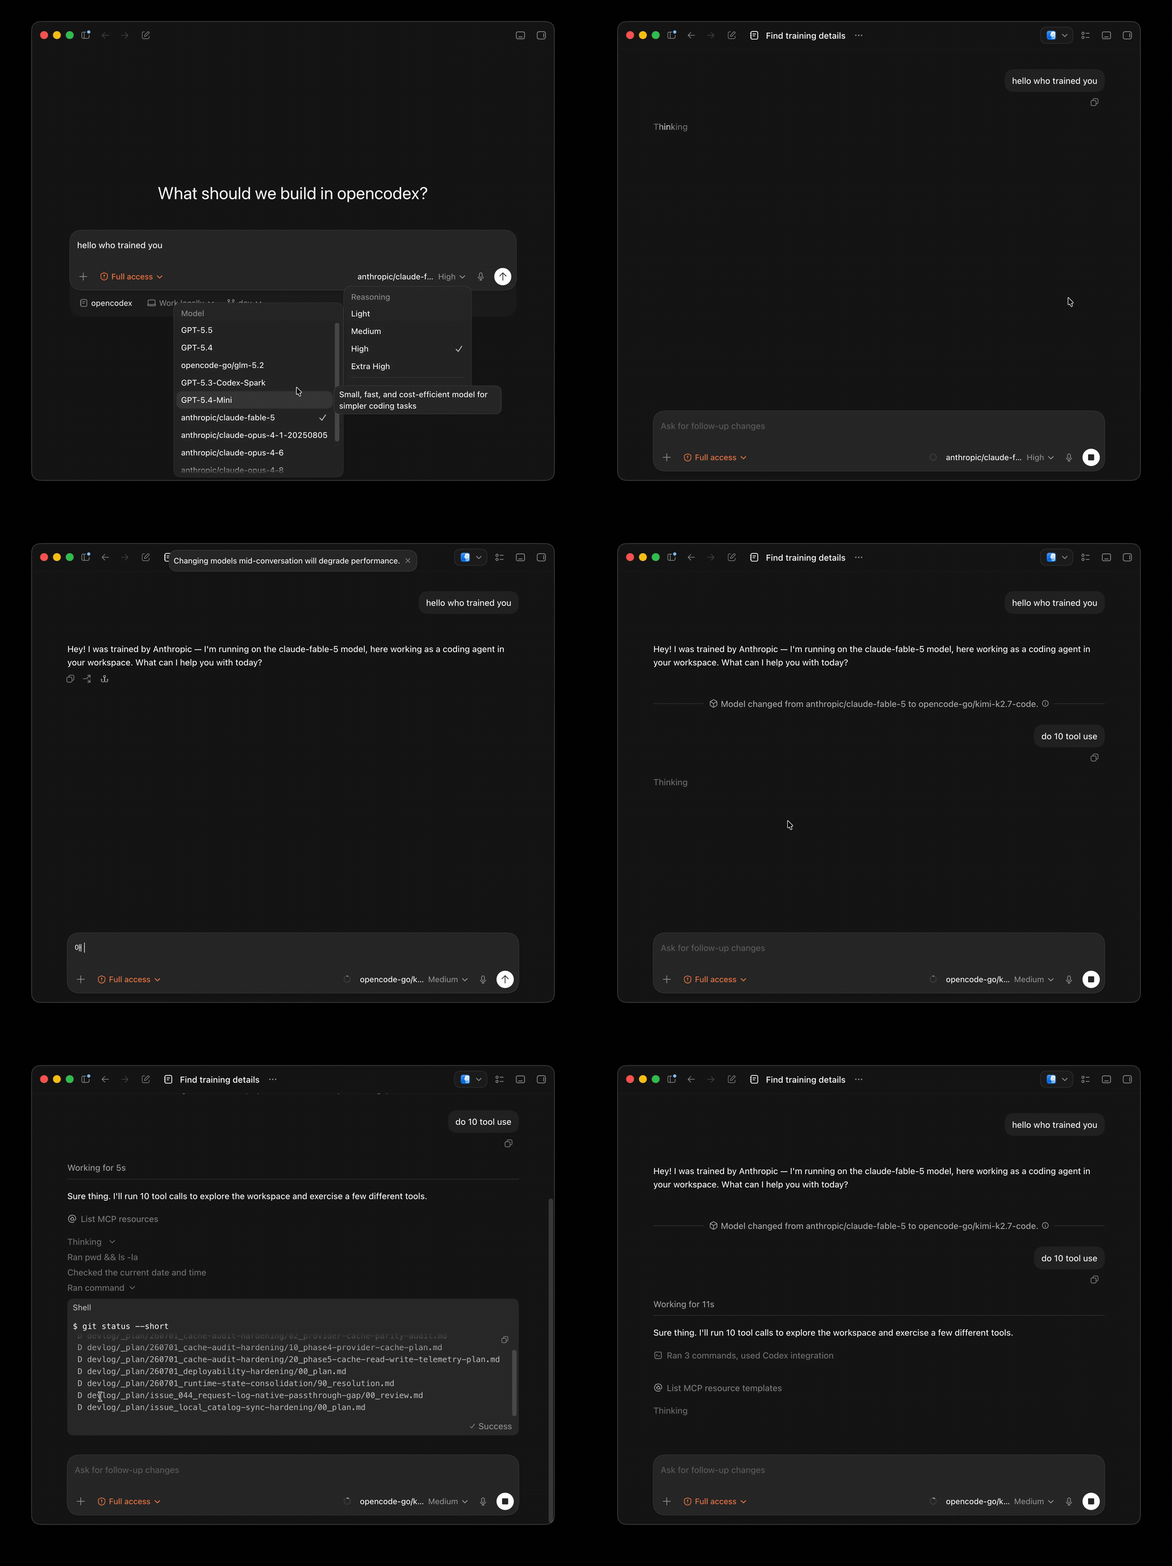
Universal provider proxy for OpenAI Codex & Claude Code — use any LLM (Claude, Gemini, Grok, DeepSeek, Ollama…) with Codex CLI, App, SDK, and Claude Code

Git-native persistent memory for AI coding agents. Implements Google OKF v0.2 with sub-300µs in-memory BM25 search, embedded MCP server, and progressive disclosure. Slashes token bloat by 80% with zero external databases or dependencies. Built in pure Go.

Local-first code intelligence graph for MCP and CLI. Builds a persistent map of your codebase so AI coding tools read only what matters, with benchmarked context reductions on reviews and large-repo workflows.

Stop your AI from making things up — it proposes, deterministic tools decide, every claim checked against ground truth with evidence. Grounded facts and context survive resets. Reverse engineering is the proving ground. MCP server + CLI.