
koala73/worldmonitorConnectors
Real-time global intelligence dashboard. AI-powered news aggregation, geopolitical monitoring, and infrastructure tracking in a unified situational awareness interface
86k
ltspice-mcp connects an agent to LTspice and ngspice so it can run simulations, read measurements, and edit LTspice schematics on real circuit files. It supports jobs, sweeps, Monte Carlo runs, waveform plotting, and structured analysis instead of raw file parsing.
Builders who use Claude Code, Cursor, Gemini CLI, or another MCP client to work on SPICE circuits.
You can ask your agent to design, simulate, and verify circuits with named results instead of manual simulator work.
Runs LTspice or ngspice decks, sweeps parameters, and returns structured measurements like cutoff frequency, overshoot, phase margin, and gm/ID.
Creates and mutates `.asc` files with placement, wiring, labels, and collision checks.
Reads finished jobs or raw output and turns waveforms into named measurements and summaries.
Submits, watches, waits on, and cancels simulation jobs with persisted state and concurrency limits.
Shows simulation waveforms in-chat where supported, or opens them on the desktop.
Exposes `ltspice_mcp.api.Api` so scripts and assistants can drive the same simulation engine.
Includes `.claude-plugin` files so Claude Code can install the server as a plugin.
/plugin marketplace add cognitohazard/ltspice-mcp
/plugin install ltspice-mcp
uv tool install ltspice-mcp # or: pipx install ltspice-mcp
WIP 0.6.0 was a breaking release: the tool surface consolidated to six operations plus a waveform widget and a code runner, and the same engine became importable as a Python API. Pin
ltspice-mcp==0.5.*if you need the old 49-tool surface.
ltspice-mcp lets LLM assistants run LTspice and ngspice simulations and edit LTspice .asc schematics. It returns structured measurements such as cutoff frequency, overshoot, phase margin, rise time, and per-device small-signal operating-point parameters (gm, gds, vth, …). Callers access these values by name without parsing raw files. It works on the same files you open in LTspice. Built on spicelib.
Claude Code — two commands, and the tools are there in your next session:
/plugin marketplace add cognitohazard/ltspice-mcp
/plugin install ltspice-mcp
Claude Desktop — build the extension in packaging/mcpb/
and drag the .mcpb file onto Claude Desktop. It installs in one click and
asks which folder your circuits are in.
Any other MCP client — Cursor, Windsurf, Gemini CLI, Continue, Cline, Zed and others. Install the server, then add it to that client's MCP config file (each client's own docs say where that file lives):
uv tool install ltspice-mcp # or: pipx install ltspice-mcp
{
  "mcpServers": {
    "ltspice": { "command": "ltspice-mcp", "args": [] }
  }
}
Needs Python 3.11 or newer; ltspice-mcp --help confirms it installed. In
Claude Code you can skip the JSON with
claude mcp add -s project ltspice -- ltspice-mcp. The same server is also
published as circuit-mcp and ngspice-mcp — same program, in case one of
those names is easier to remember.
You also need a simulator on the same machine. LTspice or ngspice —
auto-detected on Windows, Linux and macOS; on WSL you point at LTspice
yourself (WSL notes). Install LTspice if you can: .asc
schematic work needs its symbol libraries. Reading and checking netlists works
with no simulator at all. The plugin and the extension fetch the server for
you, so those two routes need uv installed.
If your assistant ignores it. Some clients don't show an assistant what a
tool does until it picks one, so it may reach for the command line instead.
Start with the name: the assistant sees every tool prefixed with it
(mcp__ltspice__run_experiments), so a name carrying the domain reads as a
SPICE tool even before anything else loads. That name is the key in the JSON
above, or the word after claude mcp add; the plugin and the extension already
use ltspice. If yours is something like sim1, rename it. Then say so
outright, in your project's CLAUDE.md (or whatever your client calls it):
Always use the ltspice MCP server for any SPICE/circuit simulation, sweep, or analysis. Do not invoke ngspice or LTspice from the shell, and do not hand-parse
.rawfiles orwrdataoutput.
That rule is absolute on purpose. An assistant invited to weigh it up will usually reach for the shell it already knows, which is the behaviour you are trying to correct. If you would rather it judge case by case, when to shell out instead gives the real boundary.
Once connected, you ask for circuit work in plain language. The assistant designs the circuit and decides what to measure; the server runs the simulator, parses the binary output, and returns the numbers. You and the assistant decide whether the results are acceptable.
"Bias this NMOS common-source stage into saturation at the target drain current and report gm/ID."
The assistant writes the netlist, solves the bias point on LTspice, and reads the device's operating point back by name — drain current, gm, gds, VDS against VDSAT to confirm it's in saturation, and the gm/ID that analog designers size to. If the bias is off, it adjusts the gate reference or W/L and re-runs, a couple of seconds per pass.
Other requests that work the same way:
.dc Vgs deck with .save @m1[gm] @m1[id], runs it on ngspice, and returns the gm/ID table as one CSV (no .control block, no rawfile parsing).inspect(kind="model")), puts it into a pulsed-gate transient, and reads Vds(on) and load current back from the .meas results..asc, with orthogonal routing and pin-collision checks.Warnings are returned with the measurements they affect. A simulator such as ngspice can report a "singular matrix" warning in its log and still finish the run and write plausible values. The server includes that diagnostic in an observations field next to the returned value.
Everything operates on ordinary LTspice and SPICE files. You and the assistant can edit the same files:
.asc; you open it in LTspice, inspect it, and tweak by hand. Your manual edits are simply the file's new state, which the assistant reads on the next request.The rule in the quick start forbids the shell outright, which is the right default for an assistant that would otherwise never find the server. The real boundary is narrower, and it matters if you drop the rule.
An agent with a shell can run quick one-off ngspice simulations directly. Local ngspice runs are scriptable and usually take under a second, so MCP adds little in that case. Use the server when you need LTspice execution, named values parsed from binary raw files, declared sweep and Monte Carlo matrices with durable idempotent submission, jobs that outlive a call, or geometry-checked .asc editing. analyze_results can also read a bare raw_path produced outside the server, so a simulation can run in the shell and be analyzed here.
Simulation and measurement. Runs LTspice or ngspice and parses the binary output directly. Measurements are computed server-side and returned as numbers: time-domain (rise/fall, overshoot, settling, delay, period/duty/jitter, RMS, THD), frequency-domain (filter cutoffs and roll-off, gain and phase at any frequency, stability margins, resonance peaks with Q, integrated noise), DC operating points, and .MEAS directive results including the ones that failed. Per-device small-signal operating-point parameters (gm, gds, vth, …) come back by name on both simulators — LTspice via an auto-added .options logopinfo block in the log, ngspice via .save @dev[param] traces. Read the set across a .dc sweep as a gm/ID table with the waveform recipe in format: "csv", or a single bias point with the operating_point recipe (address them as m1.gm / @m1[gm], no rawfile parsing).
Schematic editing. Creates and edits LTspice .asc files by placing components, wiring pins, and labeling nets. It rejects wires that collide with pins, overlap junctions, or run diagonally, and reports floating pins and dangling labels. Every edit to a file that already exists carries that file's expected_sha256; if the file changed since you read it, the call is refused and nothing is written. Plain netlists (.cir/.net/.sp) are read and checked rather than edited — you write them with your own file tools, and a static validation pass catches malformed cards before simulation begins.
Sweeps and Monte Carlo. Multi-dimensional parameter sweeps and Monte Carlo with per-component tolerances, .MODEL process variation, and Pelgrom W·L device mismatch. Per-measurement statistics are aggregated across runs, and any single run can be pulled out and analyzed like a standalone simulation.
Jobs and trust. Simulations run as cancellable jobs with timeouts and a concurrency cap; long runs return a job ID immediately and job state survives a server restart. Results include simulator warnings, missing measurements, and extreme node values as structured observations. The server does not assign a trust rating; the caller evaluates these observations.
| Simulator | Status |
|---|---|
| LTspice | Primary. Windows native, WSL2 (Windows LTspice.exe via interop), Linux via Wine. Required for .asc schematic editing (needs .asy symbol libraries). |
| ngspice | Supports simulation, parsing, diagnostics, and analysis. Does not require LTspice. |
| QSPICE, Xyce | Supported but secondary. |
No configuration is required. To customize, copy ltspice-mcp.example.toml to ltspice-mcp.toml; any setting can be overridden with an LTSPICE_MCP_-prefixed environment variable, and --config PATH or LTSPICE_MCP_CONFIG picks the file. Key options:
[simulator]
default = "ltspice"      # ltspice, ngspice, qspice, xyce (null = auto-detect)
path = ""                # explicit executable path (required on WSL)
ngbehavior = "hsa"       # ngspice compat mode; unset = spicelib default, "hsa" fixes sectioned .lib corner select

[security]
# allowed_paths = ["."]  # sandbox; unset = working dir + the Claude Code scratch dir (<tempdir>/claude-<uid>)

[simulation]
# max_parallel = 4       # default: number of CPU cores, capped at 8
timeout = 300.0          # seconds

[tools]
listing = "compact"      # "full" serves every per-argument description on the wire, about 45% more to load
run_code = true          # false removes run_code; the snippet has the server's own authority, not the sandbox

[state]
persist_jobs = true
listing = "compact", the default, keeps about 45% off what a session loads before it can call anything; the tools accept exactly the same calls, inspect(kind="reference", query="...") looks up a branch's arguments with their descriptions when you need them, and a rejected call ends with the branch's field table. listing = "full" puts every description back on the wire.
run_code, on by default, runs a Python snippet in a worker process holding the engine as api (the same six ops as methods, complete results), for loops over runs and numpy on samples. The snippet runs with the server process's own file and process authority, not inside allowed_paths: permission mcp__ltspice__run_code in your client the way you permission a shell, and never blanket-allow it as part of mcp__ltspice__*. Set run_code = false when the server is reachable by more than one trusted client, for example through a proxy in front of it; the change takes effect at the next start, and inspect(kind="capabilities") reports whether the tool is on.
See src/ltspice_mcp/config.py for the full option list ([analysis], [schematic], [logging], ...).
On WSL, LTspice.exe runs via Windows interop (not Wine), and spicelib can't auto-detect it across the WSL boundary. Set the Windows-side path explicitly:
[simulator]
path = "/mnt/c/Program Files/ADI/LTspice/LTspice.exe"
Simulation output is automatically redirected to a Windows temp directory: LTspice's .MEAS results go through SQLite .db files that fail on UNC paths (\\wsl.localhost\...), and without the redirect measurement data silently disappears from the logs.
.asy symbol paths for .asc editing are auto-detected on Windows and WSL; override with [schematic] symbol_paths or LTSPICE_MCP_SYMBOL_PATHS.
The server exposes 8 tools: six arranged over three planes, the waveform widget, and run_code, which is registered always and served unless the operator turns it off:
| Plane | Tool | What it does |
|---|---|---|
| Execute | run_experiments | Run one deck, or a grid of value assignments, model swaps, and Monte Carlo runs, in one declarative call — optionally returning the measurements with the receipt |
| Execute | jobs | Follow, wait on, cancel, list, or page the runs of a submitted job |
| Understand | analyze_results | Measure a finished job (or a bare .raw this server never ran) through named recipes |
| Understand | inspect | Read decks, schematics, symbols, nets, models, and server capabilities — never results |
| Author | edit_schematic | Create and mutate .asc transactionally: place, move, wire, label, set attributes |
| Author | verify_circuit | Syntax, symbol, layout, and quality checks, schematic-vs-netlist equivalence, and rendering |
| — | plot_waveform | Interactive chart of a run's waveforms, in-chat where the client renders widgets, otherwise opened on your desktop |
| — | run_code | Run a Python snippet in a warm worker that holds the engine as api: loops over runs, numpy on samples. On by default; [tools] run_code = false removes it, see Configuration |
Netlists are written and edited with the agent's own file tools; the server does not wrap text edits. The same six operations are importable as ltspice_mcp.api (Api(working_dir=...)), so a Python script can drive the same engine without an MCP client.
The skills/ directory carries the domain knowledge that pairs with the surface: skills/spice-experiments/SKILL.md (the experiment workflow), skills/ltspice/SKILL.md and skills/ngspice/SKILL.md (SPICE syntax per engine), skills/spice-bench-craft/SKILL.md (bench archetypes). Copy the relevant skill into your client's persistent-instructions location.
Migration from 0.5. The full (49-tool) and agentic (41-tool) profiles were removed in 0.6.0; the consolidated surface above replaces them. [tools] profile is no longer a key the server reads — a config that still sets it loads with the key ignored. Keep the [tools] section rather than deleting it: it now holds listing, above. Pin ltspice-mcp==0.5.* if you need the old per-operation tools.
Where it runs. The server shells out to a local LTspice/ngspice and reads circuit files from disk, so it must run where the simulator and the files are. Two setups work: a local MCP host (Claude Desktop, Claude Code, Cursor, Gemini CLI, Codex, …) on your own machine, or a browser-based cloud agent whose sandbox can install ngspice and register the server (verified with Claude). LTspice is local-only (a Windows app); ngspice is open-source and works in either place. Consumer web chat with no sandbox has no simulator and no file access, so it can't run this server directly; bridge it to a machine you control with a stdio→HTTP bridge such as mcp-proxy if you want that UI. Only expose the server on a network you fully control: it writes files and spawns processes inside allowed_paths.
You can use the same six operations as an MCP server or as a Python API. Both run the same engine: the same code handles each operation, reads the same files, and writes the same job records to disk.
| MCP server | Python API | |
|---|---|---|
| Who calls it | an assistant in Claude Code, Claude Desktop, Cursor, or another MCP client | a script, notebook, or CI job — usually one an assistant wrote |
| What a call looks like | a tool call in the conversation; large results are split into pages and continued with a cursor | a method call; results are returned in full, with waveforms as numpy arrays |
| Long runs | the server keeps the job running; check on it with jobs | the process owns the job; api.close() or normal interpreter shutdown cancels unfinished work |
| Good for | interactive work: explore, edit, run a few checks per turn | code: optimizers, custom post-processing, pipelines, full result sets |
A sweep or Monte Carlo matrix is one call through either interface. Use the
Python API when each run depends on code that processes the previous result,
such as an optimizer, curve fit, or CI check. The API returns the complete
result set, while MCP paginates large results. Both interfaces use the same
working directory and job records. An assistant can start a sweep over MCP,
and a script can read the completed job by its job_id. A script can also
run a batch for an assistant to analyze later.
An assistant can use either. Over MCP it calls the six tools; where it can
execute code it can drive the same engine in Python instead, through run_code
or an installed package (see below). Either way it can read the full argument
tree for itself — inspect(kind="reference") over MCP, api.reference() in
Python.
To write your own script against the engine, or to have an assistant write one that outlives the conversation, install the package:
pip install ltspice-mcp # or: uv add ltspice-mcp
This is a separate step from the quick start. The plugin and the Desktop
extension run the server in an environment of their own, so neither one puts
the package where your code can import it. An assistant working inside a
session does not need this install to write Python against the engine —
run_code runs its snippet in the server's own process, with api already
bound — but a standalone script does.
from ltspice_mcp.api import Api

with Api(working_dir="circuits") as api:
    result = api.run_experiments(
        circuits=[{"path": "rc.cir"}],
        variations=[{"kind": "assign", "assign": {"R1": ["1k", "2k", "4k"]}}],
        analyze={"recipes": [
            {"key": "fc", "metric": "bode_filter", "signal": "V(out)",
             "field": "cutoff_high_hz", "reduce": ["min", "max"]},
        ]},
    )
    print(result["analysis"]["result"]["results"]["fc"]["reduced"])
run_experiments defines a three-case sweep, measures each case, and returns
the minimum and maximum cutoff frequencies with their assignments. rc.cir is
the RC low-pass deck printed under
the tool-level loop above.
api.reference() lists the six operations. api.reference("run_experiments")
prints that operation's full argument tree. From a shell, use
python -m ltspice_mcp.api reference [op]. api.load_raw() returns numpy
arrays for direct waveform access.
The two run side by side. The MCP server is the long-lived process: it owns jobs that must outlive a call, serves the
packaged guide and job resources, and renders the waveform widget on hosts
that support it. A script using the Python API works in the same directory
against the same job records, so a job started by either can be read by the
other by its job_id. A job the script submits belongs to the script, and
exiting cancels it — unless it asks for a detached owner
(run_experiments(wait=False, detach=True)), which hands that one job to a
process spawned to supervise it. The script can then exit, and the job, the
server and any later script all still see the same record.
Api starts the same engine in the caller's process and does not require an
MCP server. Its interface differs from MCP:
run_experiments(wait=False) returns a receipt immediately, and unfinished
jobs are cancelled by api.close(), at the end of a with block, or during
normal interpreter shutdown. Adding detach=True gives that job its own
supervising process instead: the call still returns as soon as the
submission is durable, the receipt names the owner and its log, and the job
runs on after this process exits. Read it back or cancel it later by
job_id, from here, a later script, or a server.Api created inside a running server
process raises an error. A cold Api() starts in well under a second; the
heavy imports are loaded by the first call that needs them.api.load_raw() / api.measurements() return numpy-backed data for your
own post-processing, and api.reference(op) prints any operation's full
argument tree.What the assistant actually does for "design a 1 kHz RC low-pass and verify it". It writes the netlist (R=1k, C=159.155n → fc = 1 kHz):
* rc.cir — RC low-pass
V1 in 0 AC 1
R1 in out 1k
C1 out 0 159.155n
.ac dec 50 1 1Meg
.end
then drives two tools:
verify_circuit(path="rc.cir", checks=["syntax"])
  → outcome "complete", no findings: directives valid, element arities check out

run_experiments(
  circuits=[{"path": "rc.cir"}],
  analyze={"recipes": [{"key": "lp", "metric": "bode_filter", "signal": "V(out)"}]},
)
The lp recipe returns these scalar results:
{
  "signal": "V(out)",
  "filter_type": "lowpass",
  "passband_gain_db": 0.0,
  "passband_ripple_db": 0.02,
  "cutoff_low_hz": null,
  "cutoff_high_hz": 1000.4,
  "stopband_rejection_db": 59.97,
  "rolloff_slope_db_per_decade": -19.9,
  "estimated_order": 1,
  "warnings": []
}
(abridged — the full response also includes passband bounds and transition bandwidth)
If the result is off target, edit the netlist, run it again, and repeat the measurement. Long simulations return a job ID instead of blocking. Use jobs with action="status", action="wait", or action="cancel" to manage them. Job metadata persists in per-circuit sidecars ({dir}/.ltspice-mcp/jobs/ — add .ltspice-mcp/ to your .gitignore), and MCP resources (spice://results/..., spice://netlists/..., spice://config) expose jobs, signals, measurements, and config for browsing.
Every tool declares MCP annotations (readOnlyHint, destructiveHint, idempotentHint, openWorldHint) and an outputSchema for structuredContent introspection. The capabilities live one level down, as the named values each tool accepts:
| Surface | Values |
|---|---|
analyze_results recipes | summary, measurements, value, signal_stats, edges, `timin |
Sign in to join the discussion.
No comments yet. Be the first to say what this is good for.
Real-time global intelligence dashboard. AI-powered news aggregation, geopolitical monitoring, and infrastructure tracking in a unified situational awareness interface
High-performance code intelligence MCP server. Indexes codebases into a persistent knowledge graph — average repo in milliseconds. 158 languages, sub-ms queries, 99% fewer tokens. Single static binary, zero dependencies.
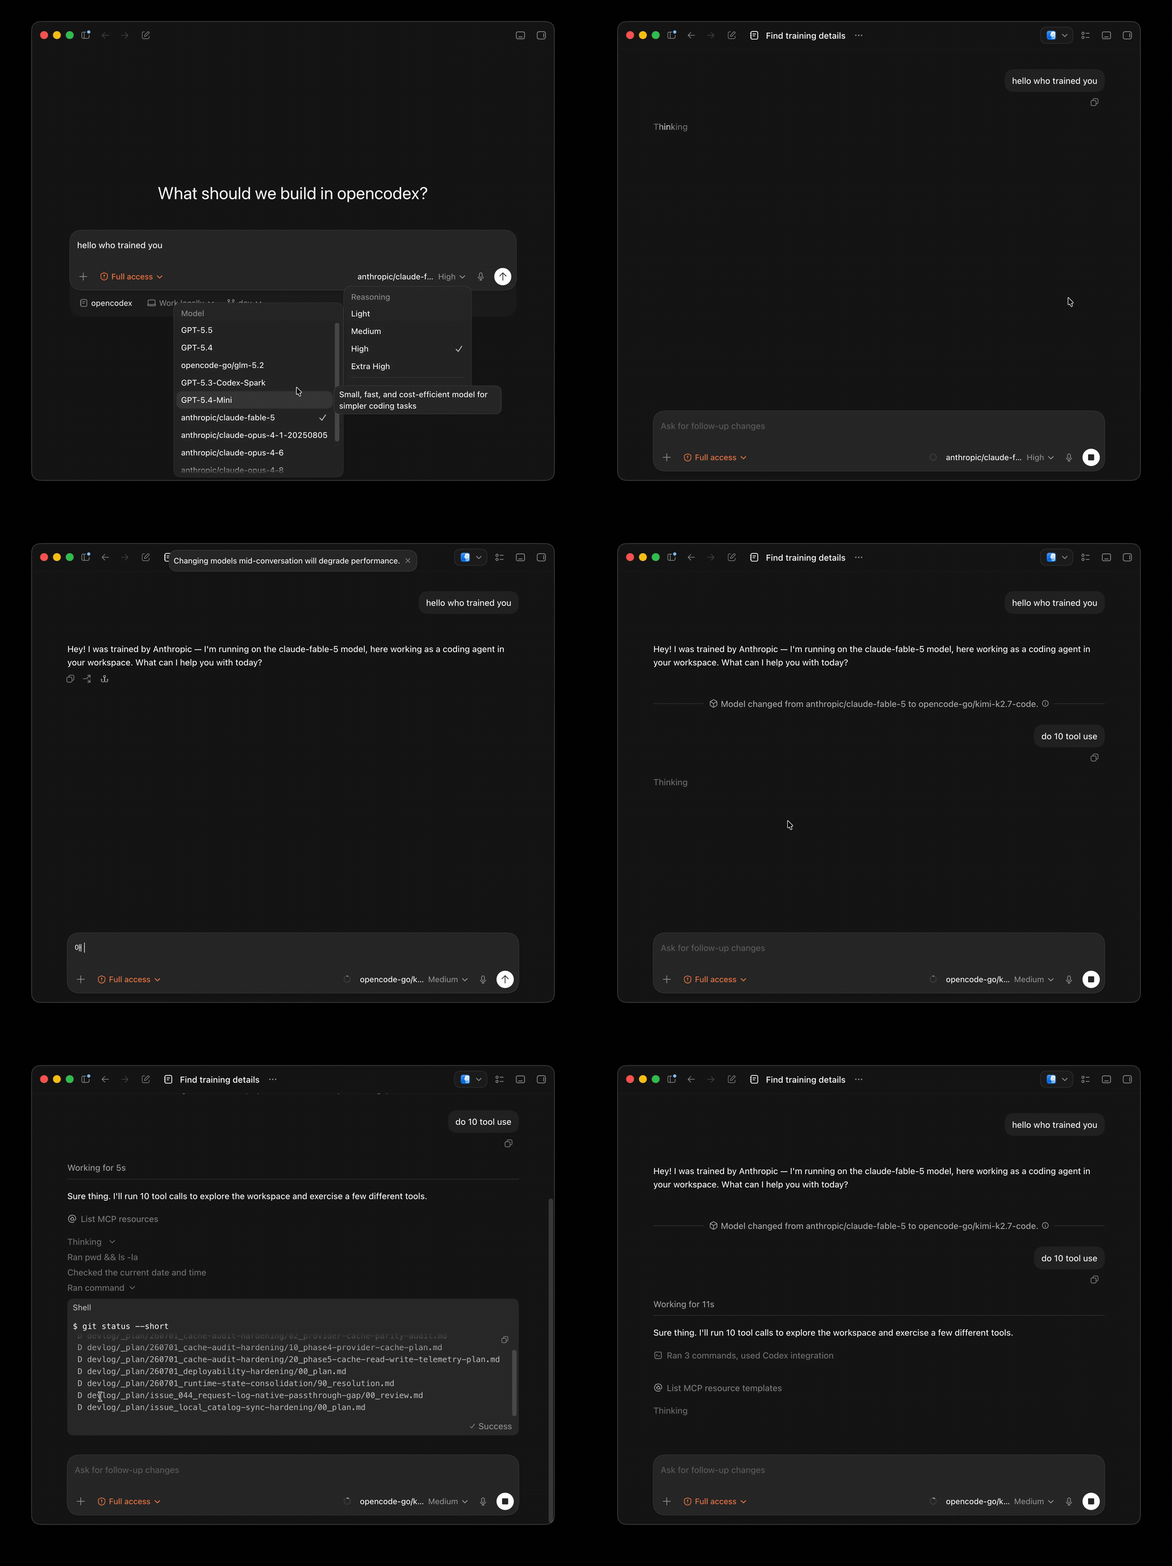
Universal provider proxy for OpenAI Codex & Claude Code — use any LLM (Claude, Gemini, Grok, DeepSeek, Ollama…) with Codex CLI, App, SDK, and Claude Code

Git-native persistent memory for AI coding agents. Implements Google OKF v0.2 with sub-300µs in-memory BM25 search, embedded MCP server, and progressive disclosure. Slashes token bloat by 80% with zero external databases or dependencies. Built in pure Go.

Local-first code intelligence graph for MCP and CLI. Builds a persistent map of your codebase so AI coding tools read only what matters, with benchmarked context reductions on reviews and large-repo workflows.

Stop your AI from making things up — it proposes, deterministic tools decide, every claim checked against ground truth with evidence. Grounded facts and context survive resets. Reverse engineering is the proving ground. MCP server + CLI.