
JuliusBrussee/
caveman

🪨 why use many token when few token do trick — Claude Code skill that cuts 65% of tokens by talking like caveman
105k
1 add
agenttop reads local usage data from supported AI coding tools and turns it into a shared view of sessions, token counts, and spend. It shows the data in a terminal UI and a web UI, with optional analysis for selected sessions.
Builders who want to see where their agent tokens, sessions, and costs are going across multiple tools.
You can spot which projects, models, and prompts are burning time and money instead of guessing.
Collects local session data from Claude Code, Cursor, Kiro, Codex, and Copilot into one view.
Shows live summaries in a Textual terminal app and a FastAPI web dashboard with sessions and analysis tabs.
Breaks usage down by project, model, day, hour, and individual tool calls with per-session cost estimates.
Labels work as coding, debugging, testing, exploration, refactoring, git ops, planning, or other from tool-call data and prompts.
Runs selected sessions through a Map-Reduce-Generate analysis flow with local or cloud LLMs.
Reads tool data from local files and databases without telemetry or writing back to those directories.
curl -fsSL https://raw.githubusercontent.com/vicarious11/agenttop/main/install.sh | bash
curl -fsSL https://raw.githubusercontent.com/vicarious11/agenttop/main/install.sh | bash -s -- web-demo
# modes: web | web-demo | tui | tui-demo | none
agenttop               # terminal dashboard — your real data
agenttop --demo        # terminal — demo data (safe for recordings)
agenttop web           # web dashboard at localhost:8420
agenttop web --demo    # web — demo data

htop for AI coding agents.
See exactly where your Claude, Cursor, Kiro, Copilot, and Codex tokens are going — and what it's costing you.
Install · What you get · vs other tools · How it works · AI Analysis · Roadmap





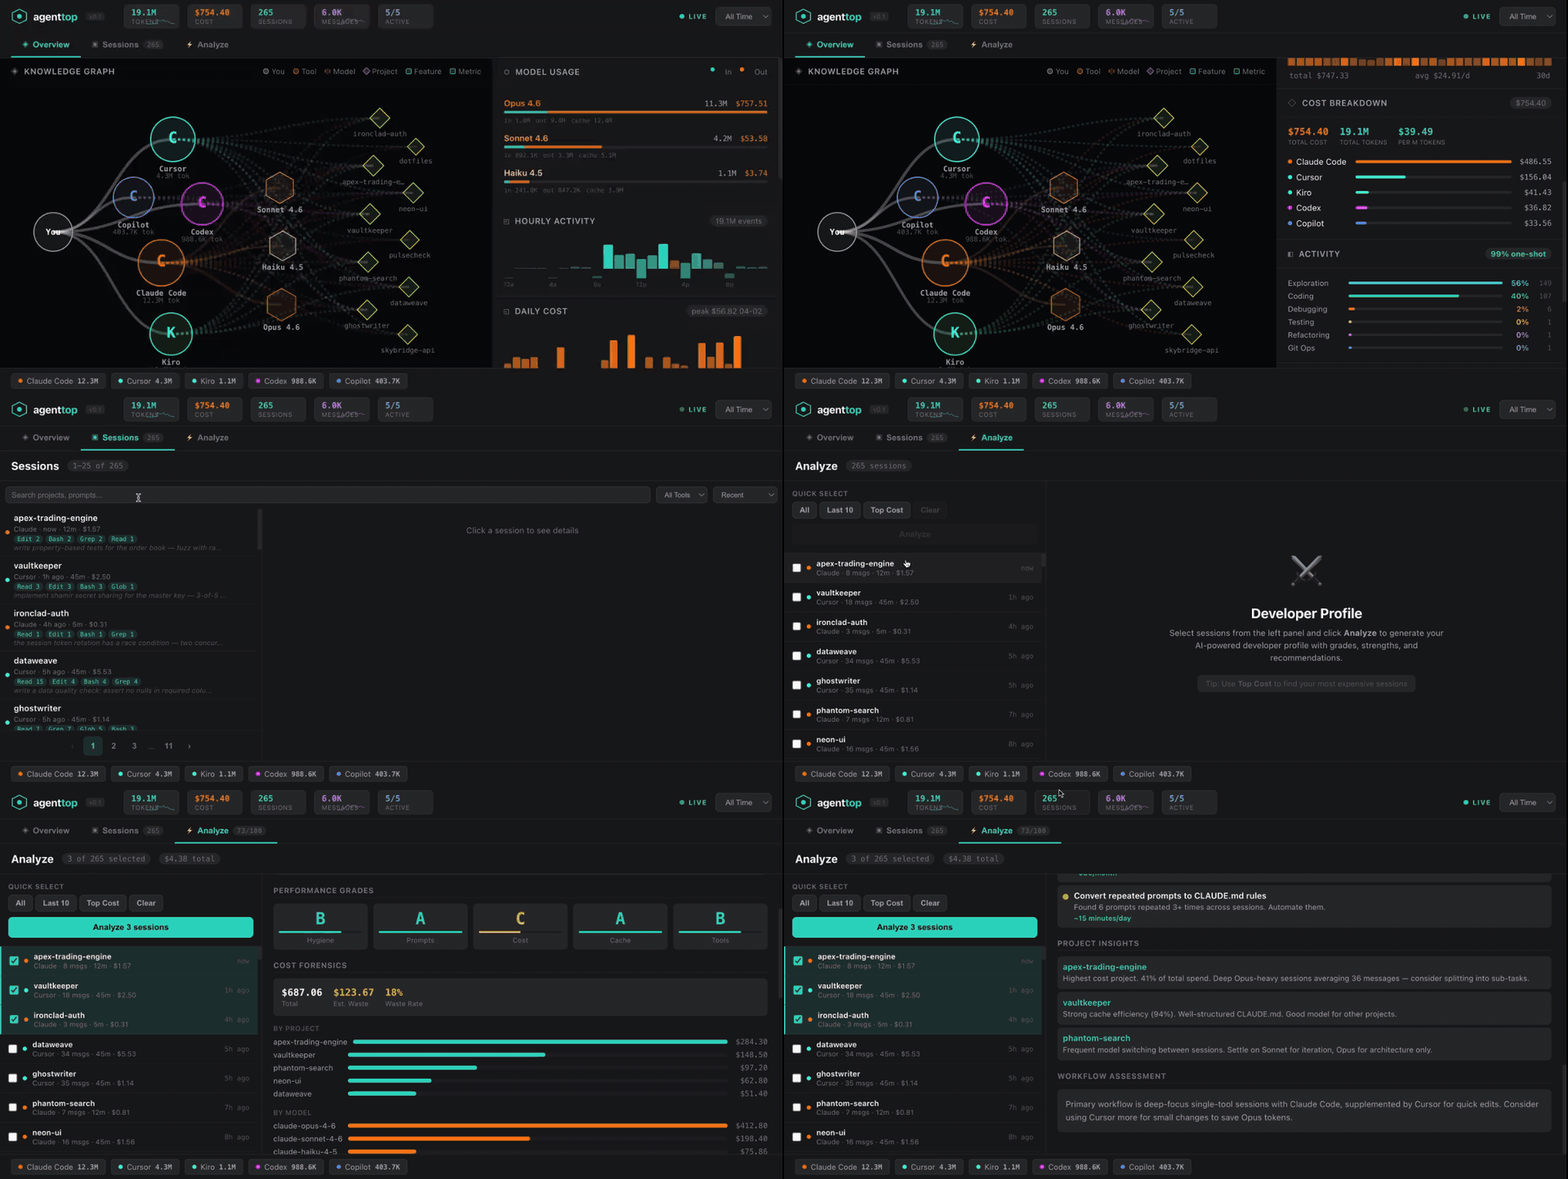
I was using Claude Code, Cursor, and Kiro every day. Each of them stores usage data locally — JSONL logs, SQLite databases, workspace state — but none of them show you the full picture. I had no idea:
So I built agenttop. One view across every tool. Real numbers computed from actual tool-call data, not keyword guessing. Optional AI analysis that tells you specifically what to change. All local. Nothing leaves your machine.
One line. Installs everything, asks what to launch (web / TUI, real data / demo).
curl -fsSL https://raw.githubusercontent.com/vicarious11/agenttop/main/install.sh | bash
Skip the menu and jump straight into a mode:
curl -fsSL https://raw.githubusercontent.com/vicarious11/agenttop/main/install.sh | bash -s -- web-demo
# modes: web | web-demo | tui | tui-demo | none
After install:
agenttop               # terminal dashboard — your real data
agenttop --demo        # terminal — demo data (safe for recordings)
agenttop web           # web dashboard at localhost:8420
agenttop web --demo    # web — demo data
Requirements: Python 3.10+, git. No Docker. No API keys needed. macOS, Linux, Windows (WSL).
Keyboard (TUI): d dashboard · s sessions · e explorer · a analysis · k graph · 1-4 time range · q quit
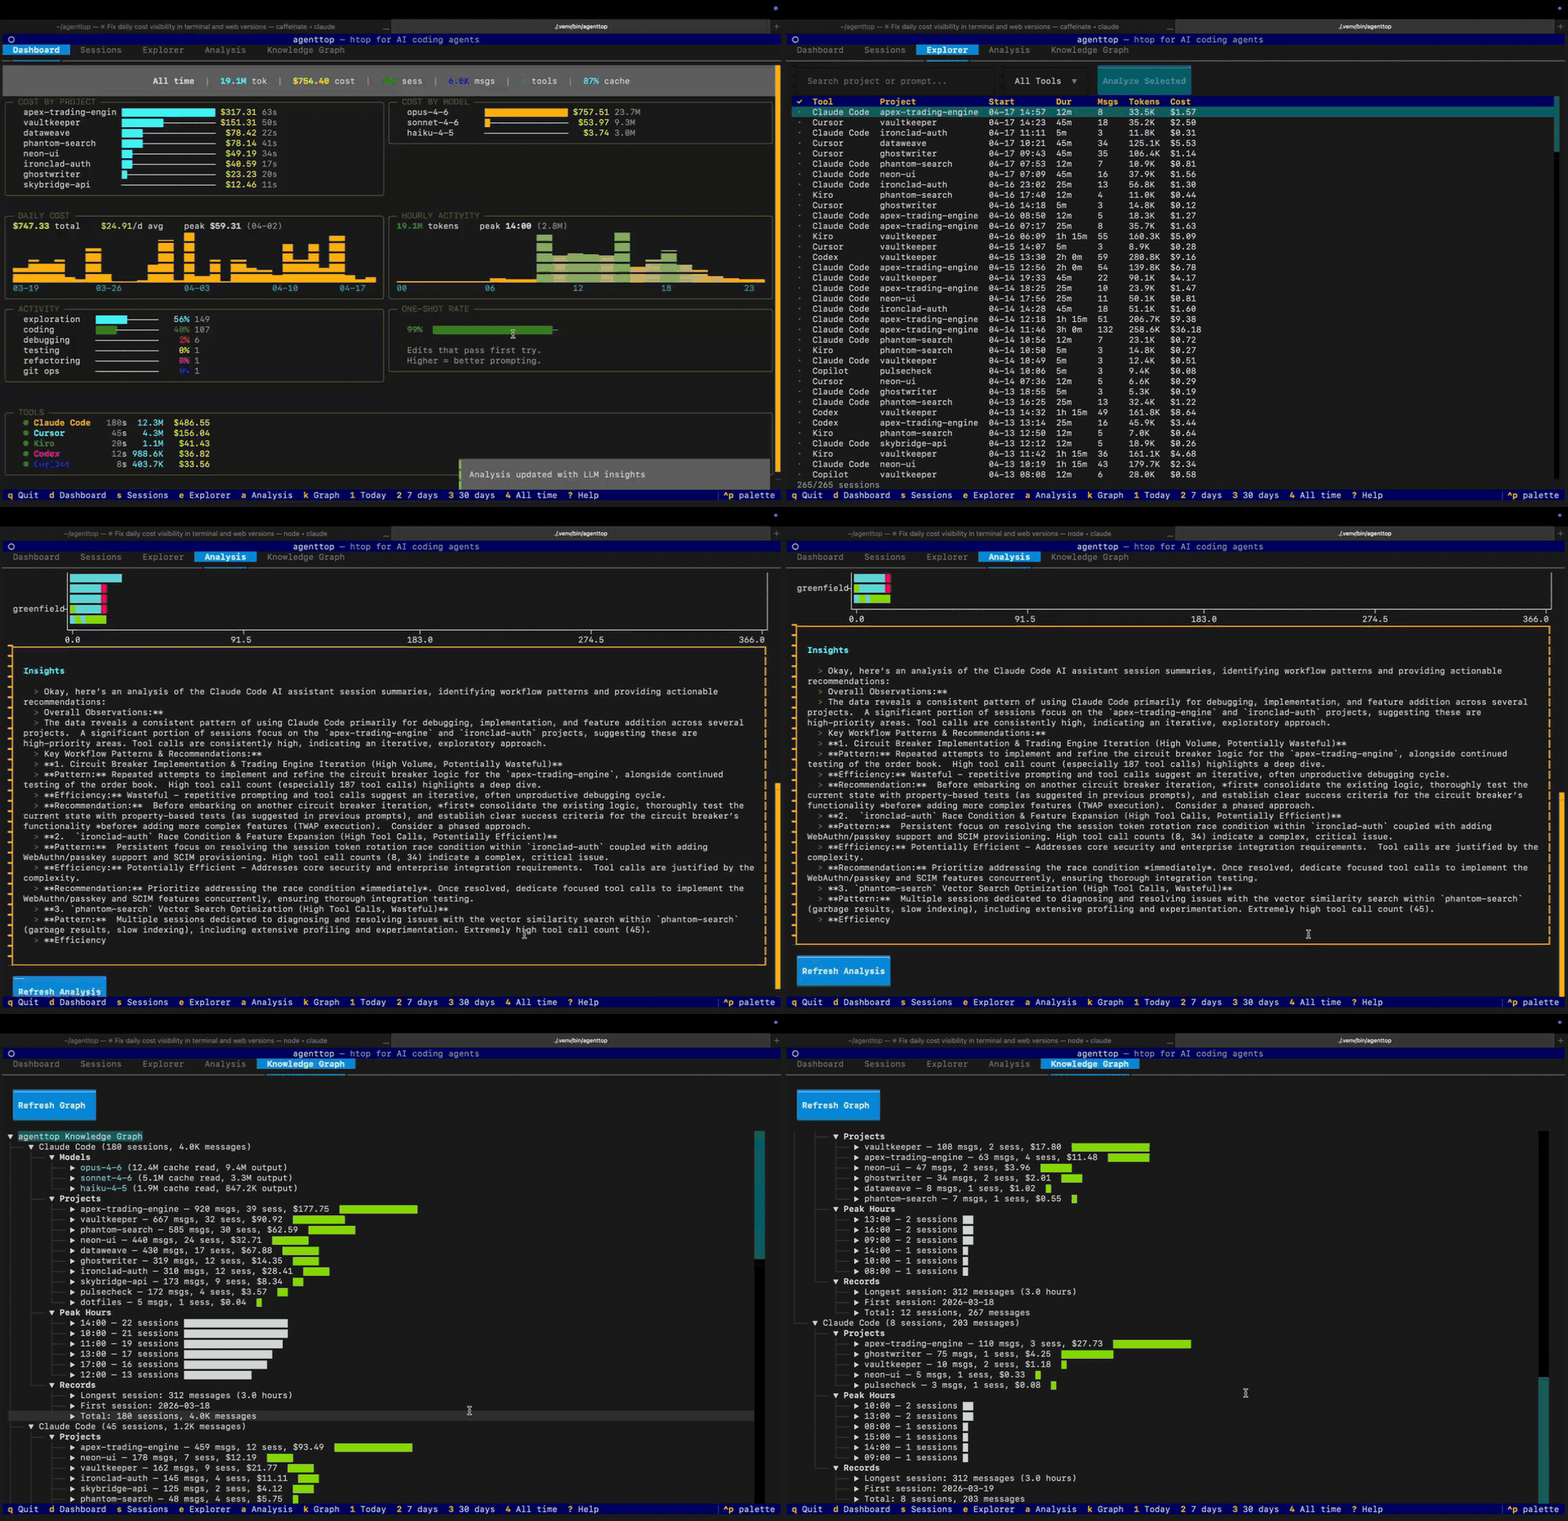
7 panels, updates live:
Three tabs:
URL hash routing (#sessions, #analyze) for deep links.
| agenttop | ccusage | cursor-stats | Anthropic Console | |
|---|---|---|---|---|
| Claude Code | ✅ full | ✅ | ❌ | ✅ web only |
| Cursor | ✅ | ❌ | ✅ | ❌ |
| Kiro | ✅ | ❌ | ❌ | ❌ |
| Copilot | ✅ | ❌ | ❌ | ❌ |
| Codex | ✅ | ❌ | ❌ | ❌ |
| Per-tool-call breakdown | ✅ (Edit/Bash/Read counts) | ✅ | ❌ | ❌ |
| Cross-tool unified view | ✅ | — | — | ❌ |
| Session-scoped cost analysis | ✅ | ❌ | ❌ | ❌ |
| AI-powered recommendations | ✅ (local LLM option) | ❌ | ❌ | ❌ |
| Terminal UI + Web UI | ✅ | CLI only | ❌ | Web only |
| Zero telemetry | ✅ | ✅ | ✅ | ❌ |
| One-line install | ✅ | npm | — | — |
If you only use Claude Code, ccusage is lighter-weight. If you use 2+ AI coding tools, agenttop is the only thing that shows you a unified picture.
| Tool | Source | What agenttop extracts |
|---|---|---|
| Claude Code | ~/.claude/projects/**/*.jsonl | Exact per-message token counts (input, output, cache read, cache create). Model per message. Every tool call name (Edit, Bash, Read, Grep, Agent, Write — from tool_use content blocks). Up to 50 user prompts per session. Project path from cwd. Cost from per-model pricing. |
| Cursor | ~/.cursor/ai-tracking/ai-code-tracking.db | Conversations from SQLite. Source type (tab/composer/chat). AI vs human code ratio from scored_commits. Model per code hash. Project resolution via ide_state.json workspace mapping. |
| Kiro | ~/Library/.../Kiro/User/globalStorage/state.vscdb | Session data from VS Code state DB. Keys matching kiro%, chat%, session%. Message counts and timestamps. |
| Codex | ~/.codex/ | Prompt history from .codex-global-state.json. Session rollouts from sessions/. Automation data from SQLite. Config (model, reasoning effort). |
| Copilot | ~/.config/github-copilot/session-state/ | Per-session JSON with message content. Model extraction. Custom agent detection. Token estimation from content length. |
agenttop never writes to your tool data.
Deterministic. No LLM. Classified from actual tool-call data (Claude Code), falls back to prompt keywords for tools that don't expose tool calls.
| Activity | How it's detected |
|---|---|
| coding | Edit, Write, MultiEdit tool calls |
| debugging | Bug/error/fix keywords + Edit/Bash patterns |
| testing | Bash calls with pytest/jest/vitest/cargo test |
| exploration | Read, Grep, Glob calls without edits |
| refactoring | Refactor/rename/extract keywords + Edit patterns |
| git ops | Bash calls with git commands |
| planning | EnterPlanMode, TaskCreate, Agent tool calls |
| other | Everything else |
Percentage of edit turns that pass without retry. Detects Edit → correction prompt → Edit retry cycles. Higher = better prompting, fewer wasted tokens.
When tool_breakdown is available (Claude Code), uses actual Edit/Write call counts. Falls back to prompt analysis for other tools.
cacheReadInputTokens vs inputTokens in Claude Code dataSession(
tool_breakdown={"Edit": 5, "Bash": 3, "Read": 12, "Grep": 4},
models_used={
"claude-opus-4-6": {
"inputTokens": 4200, "outputTokens": 38000,
"cacheReadInputTokens": 12000,
"cacheCreationInputTokens": 800, "count": 8,
},
},
prompts=["fix the race condition in...", ...],
total_tokens=48291,
estimated_cost_usd=12.47,
message_count=23,
tool_call_count=24,
# + id, tool, project, start_time, end_time
)
models_used stores exact per-model token breakdown. When you analyze 3 sessions, costs are computed from those 3 sessions' real tokens, not global averages.
Optional. Select sessions, run LLM analysis, get a report.
Three-phase pipeline (Map-Reduce-Generate):
MAP — batches selected sessions into LLM calls with full prompt history. Classifies each: intent, correction spirals, prompt quality, wasted effort. Results cached per session ID — sessions are immutable, never re-analyzed.
REDUCE — pure Python, no LLM. Deterministic score from 5 dimensions (0–20 points each):
| Dimension | Source | Formula |
|---|---|---|
| Session hygiene | MAP classifications | spiral_free_sessions / total × 20 |
| Prompt quality | MAP classifications | no_waste_sessions / total × 20 |
| Cost efficiency | Python cost forensics | (1 - waste_pct / 100) × 20 |
| Cache efficiency | Claude model_usage | cache_hit_rate / 100 × 20 |
| Tool utilization | Feature detection | features_used / available × 20 |
GENERATE — single LLM call with ~2K tokens of pre-computed metrics. LLM writes prose (developer profile, recommendations, project insights). Does NOT compute any numbers — those come from REDUCE.
Score is fully traceable. "Session hygiene: 14/20 — 23/30 sessions had no correction spirals."
LLM providers: Ollama (free, local — nothing leaves your machine), Anthropic, OpenAI, OpenRouter.
agenttop init # interactive setup wizard
Safe for recordings and screenshots. Generates realistic fake data — 10 projects, 265 sessions across 5 tools, with handwritten prompts that read like real engineering work.
agenttop --demo        # terminal with fake data
agenttop web --demo    # web dashboard with fake data
Deterministic. Same screenshots every time.
~/.claude/  ~/.cursor/  ~/.codex/  ~/.config/github-copilot/  ~/Library/.../Kiro/
     |           |          |              |                        |
     v           v          v              v                        v
  COLLECTORS — parse tool-specific local files
  │  Claude:  JSONL → exact tokens, tool names, model per message
  │  Cursor:  SQLite → conversations, AI vs human ratio, models
  │  Codex:   JSON + SQLite → prompts, automations, rollouts
  │  Copilot: JSON → session messages, model, agents
  │  Kiro:    SQLite → VS Code state keys
  │
  └──> unified Session model (tool_breakdown, models_used, prompts, tokens, cost)
          │
          ├──> WEB DASHBOARD (FastAPI + D3 + vanilla JS, port 8420)
          │    overview (knowledge graph) | sessions (paginated) | analyze
          │
          ├──> TERMINAL DASHBOARD (Textual + Rich)
          │    dashboard | sessions | explorer | analysis | graph
          │
          └──> OPTIMIZER (Map-Reduce-Generate, optional)
               MAP: batch LLM call, cached per session
               REDUCE: deterministic score 0-100
               GENERATE: prose recommendations
Zero config by default. For AI analysis:
agenttop init
or manually:
# ~/.agenttop/config.toml
[llm]
provider = "ollama"           # ollama | anthropic | openai | openrouter
model = "ollama/gemma3:4b"    # any litellm-compatible model
Environment variable overrides: AGENTTOP_LLM_PROVIDER, AGENTTOP_LLM_MODEL, ANTHROPIC_API_KEY.
pipx install agenttop coming soonStar the repo to follow — star count is how I decide what to build next.
BaseCollector in src/agenttop/collectors/, register it in src/agenttop/web/server.py and src/agenttop/tui/app.py. See claude.py for the reference implementation._compute_deterministic_score() in src/agenttop/web/optimizer/optimizer.py.pytest before submitting.Apache 2.0.
@AbhilashSri (workflow intelligence, code reviews), @Mohit, @Akshit (testing, UX).
Sign in to join the discussion.
No comments yet. Be the first to say what this is good for.
🪨 why use many token when few token do trick — Claude Code skill that cuts 65% of tokens by talking like caveman

The best-benchmarked open-source AI memory system. And it's free.

Orca is the ADE for working with a fleet of parallel agents. Run any coding agent with your own subscription. Available on desktop, mobile and remote runtime.
A cross-platform desktop All-in-One assistant for Claude Code, Codex, OpenCode, OpenClaw, Grok Build & Hermes Agent. Only official website: ccswitch.io

Never stop coding. Free MIT AI gateway: one endpoint, 352 providers (150+ free), 1200+ models Kimi, Claude, GPT, Gemini, GLM, DeepSeek, MiniMax. Works with Claude Code, Codex, Cursor, OpenCode, Cline & Copilot. Quota-aware auto-fallback, RTK+Caveman compression saves 15-95% tokens, MCP/A2A, Desktop/PWA. Built by 550+ contributors

Compress tool outputs, logs, files, and RAG chunks before they reach the LLM. 20% fewer tokens for coding agents, 60-95% fewer tokens for JSON, same answers. Library, proxy, MCP server.