
JuliusBrussee/
caveman

🪨 why use many token when few token do trick — Claude Code skill that cuts 65% of tokens by talking like caveman
105k
1 add
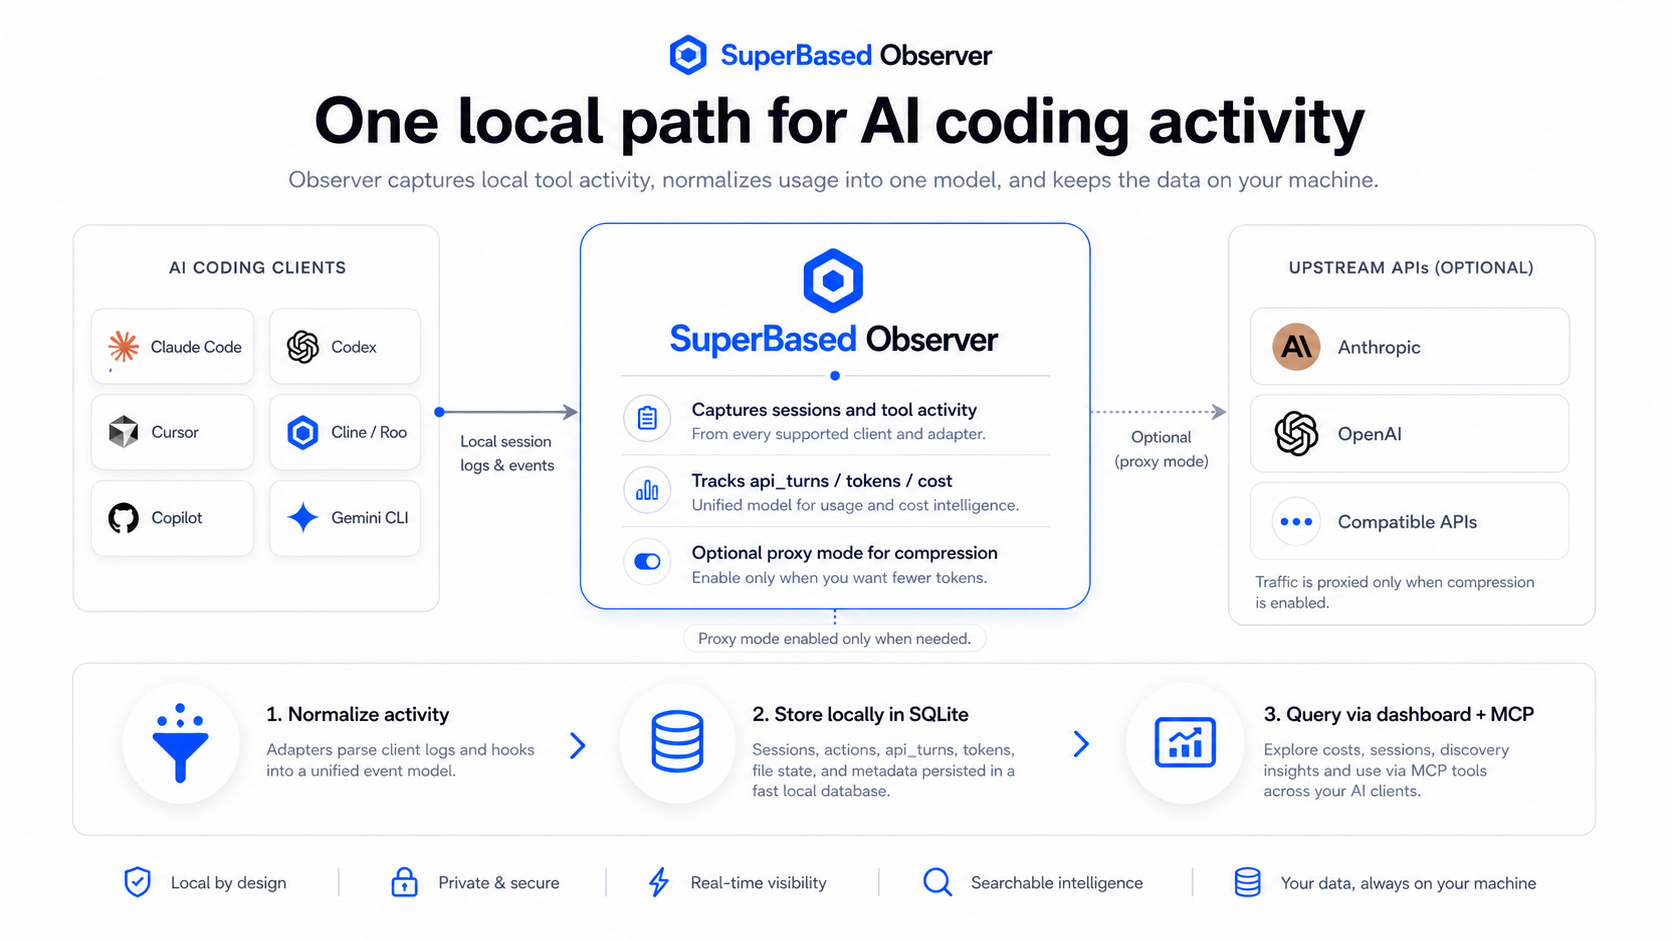
SuperBased is a local Go binary that watches and proxies AI coding tools, then stores their sessions in a local database. It combines a dashboard, CLI, MCP server, hooks, and proxy routing so you can launch, track, and compare agent work without sending data off your machine.
Builders who want one local place to control, observe, and compare AI coding sessions across multiple agents.
You can see what your agents did, what they cost, and how they touched files without re-explaining your setup.
Starts the proxy, watcher, and dashboard with `observer start`, and can launch or join AI CLI sessions from the terminal or UI.
Captures token counts, cache splits, reasoning tokens, and per-model cost across many coding tools, then stores them locally.
Supports remote control and browser-terminal workflows so sessions can be observed and managed from the control plane.
Can write MCP server entries and hook entries into supported tools with `observer init`.
Provides a web dashboard plus commands like `observer doctor`, `observer status`, `observer tail`, and `observer cost`.
Tracks prompt cache behavior and compression savings from proxy traffic and transcript backfills.
npx @superbased/observer
code --install-extension superbased.superbased-observer
npm install -g @superbased/observer
observer --version
pip install superbased-observer            # plain pip
uv tool install superbased-observer        # uv (isolated env, fastest)
pipx install superbased-observer           # pipx (isolated env)
observer --version
go install github.com/marmutapp/superbased-observer/cmd/observer@latest
observer --version
# Linux x64 example — substitute your platform + version.
VERSION=v1.6.21
PLAT=linux-x64
curl -L -O https://github.com/superbasedapp/observer/releases/download/$VERSION/observer-$VERSION-$PLAT.tar.gz
curl -L -O https://github.com/superbasedapp/observer/releases/download/$VERSION/SHA256SUMS
shasum -a 256 -c SHA256SUMS --ignore-missing
tar -xzf observer-$VERSION-$PLAT.tar.gz
./observer --version
The exact tokens your AI provider billed you — cache splits, reasoning tokens, long-context surcharges — reconciled across 29 coding tools, entirely on your own machine. Nothing you build here ever leaves your machine unless you opt a node into it.





If SuperBased catches something useful in your next bill, a star helps other people looking for the same thing find it.
npx @superbased/observer
On a fresh machine — no ~/.observer/observer.db, no
~/.observer/config.toml — this scans every AI coding tool's own
local session files into a throwaway temp database, prints one cost
table grouped by tool and model, and deletes the database again before
it exits. It's local-only: zero network calls, and nothing is written
outside that temp directory (foreign-mount adapter mirrors — e.g. WSL
reading a Windows-side tool store — are redirected there too; pricing
is embedded in the binary, not fetched at runtime).
Already have SuperBased set up (or want the explicit form)? Run
observer usage. Bare observer only runs the one-shot on a machine
with no local SuperBased state at all — otherwise it prints the usual
welcome screen (OBSERVER_ONESHOT=off to always get the welcome
screen). This is the zero-config sibling of observer cost: usage
rolls up whatever session files it finds into a throwaway DB; cost
queries the DB you've actually been capturing into with observer scan / observer start — including any proxy-accurate turns. Full
reference: docs/one-shot-usage-report.md.
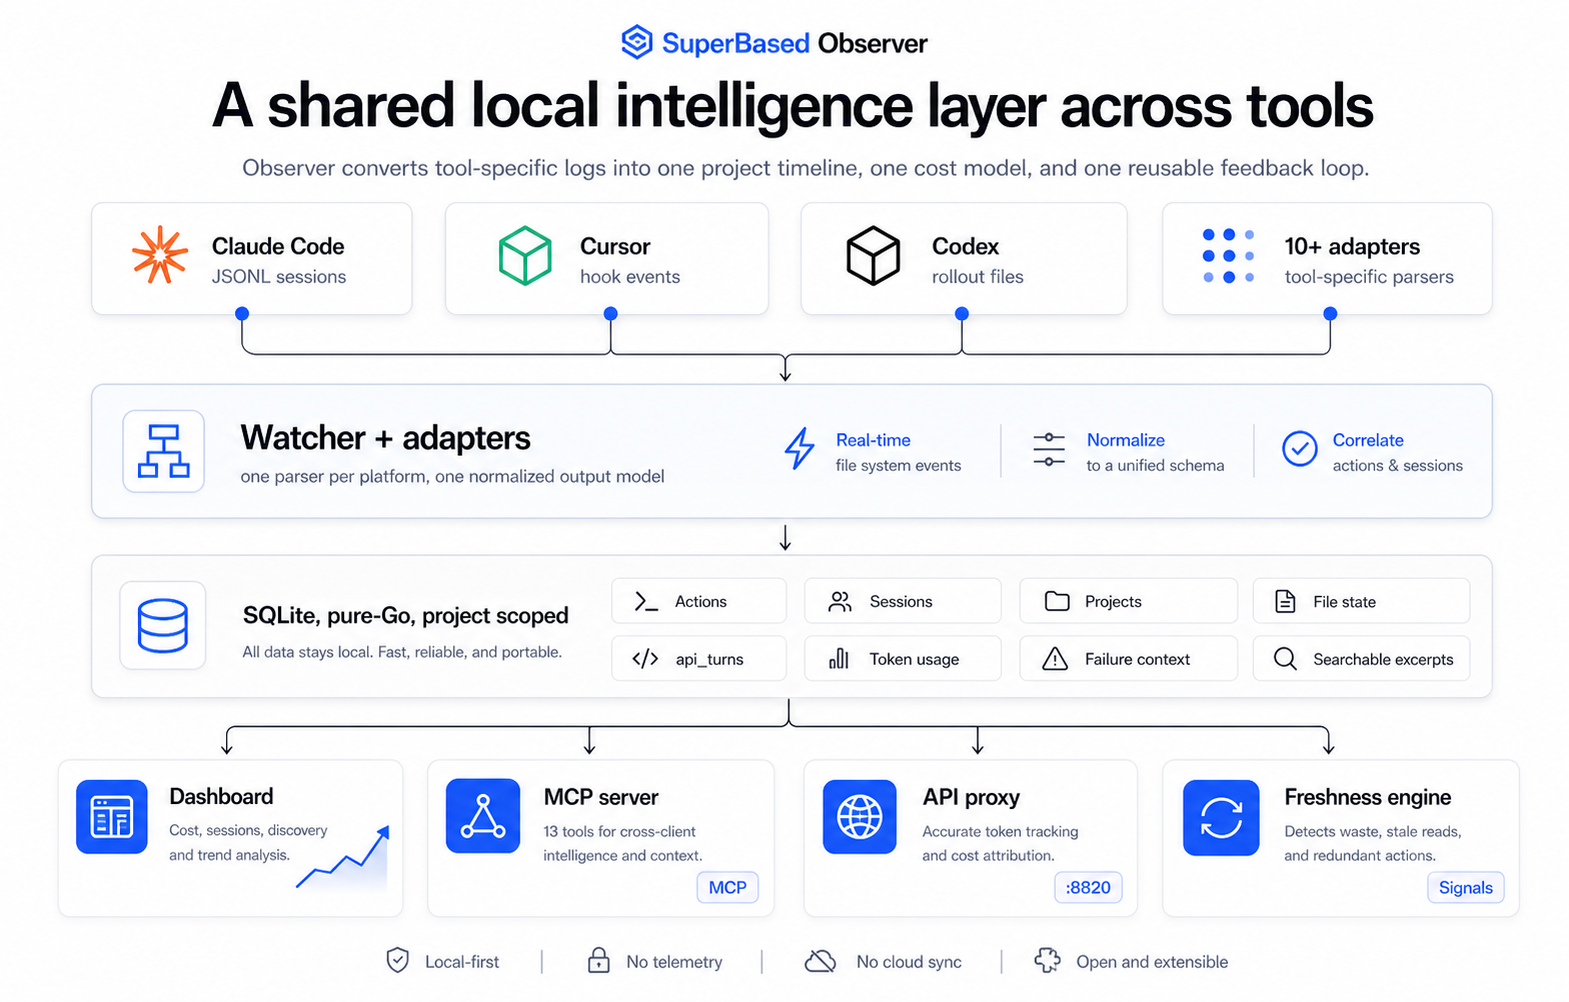
A single local Go binary built on three things a hosted usage console can't give you, in order of how much they matter:
PRIVACY.md.*-web adapters cover ChatGPT/Claude.ai/Gemini/Copilot/Perplexity
in the browser — those need the browser-capture extension, which
today only installs unpacked; every tool listed above works out of
the box.) Twenty-two of those are also full CLI launchers you can
run as real terminals — from the dashboard or your own shell,
captured through the same pipeline — see
Terminals below.Raw token counting across tools is table stakes here — it's the substrate the accurate-cost layer above is built on, not the pitch.
One local binary. SuperBased captures, normalizes, and analyzes AI coding tool activity on your own machine: proxy-accurate cost, compression, cache tracking, and session handoff for every AI coding tool you run.
It answers questions like:
Pick whichever package manager fits your environment — npm and PyPI
ship the same prebuilt binary from the same v* tag, version
numbers kept in lock-step.
code --install-extension superbased.superbased-observer
The VS Code extension bundles the observer binary, lifts the dashboard / sidebar / status bar / file decorations into the editor, and contributes a terminal profile that pre-exports the proxy env vars so AI CLIs launched from it route through observer automatically. Cursor, VSCodium, and Windsurf install the same VSIX via Open VSX.
After install, VS Code's Get Started page surfaces an in-editor
walkthrough; the long-form user guide lives at
docs/vscode-extension-user-guide.md
and the command + settings reference is at
docs/vscode-extension.md.
npm install -g @superbased/observer
observer --version
pip install superbased-observer            # plain pip
uv tool install superbased-observer        # uv (isolated env, fastest)
pipx install superbased-observer           # pipx (isolated env)
observer --version
Wheels ship for manylinux2014_{x86_64,aarch64},
macosx_*_{x86_64,arm64}, and win_amd64. uv tool and pipx
keep the install isolated from your project's Python env — generally
what you want for a CLI tool.
go install github.com/marmutapp/superbased-observer/cmd/observer@latest
observer --version
Each tagged release attaches per-platform archives to the
Releases page,
verifiable against the published SHA256SUMS:
| Asset | Platform | Contents |
|---|---|---|
observer-vX.Y.Z-linux-x64.tar.gz | Linux x86_64 | observer + antigravity-bridge.exe (for WSL2) |
observer-vX.Y.Z-linux-arm64.tar.gz | Linux arm64 | observer + antigravity-bridge.exe (for WSL2) |
observer-vX.Y.Z-darwin-x64.tar.gz | macOS Intel | observer |
observer-vX.Y.Z-darwin-arm64.tar.gz | macOS Apple Silicon | observer |
observer-vX.Y.Z-win32-x64.zip | Windows x86_64 | observer.exe |
SHA256SUMS | — | sha256 of all five archives |
# Linux x64 example — substitute your platform + version.
VERSION=v1.6.21
PLAT=linux-x64
curl -L -O https://github.com/superbasedapp/observer/releases/download/$VERSION/observer-$VERSION-$PLAT.tar.gz
curl -L -O https://github.com/superbasedapp/observer/releases/download/$VERSION/SHA256SUMS
shasum -a 256 -c SHA256SUMS --ignore-missing
tar -xzf observer-$VERSION-$PLAT.tar.gz
./observer --version
The binary is pure Go — no CGO, no external runtime dependencies.
SQLite storage is pure-Go via modernc.org/sqlite. Single static
binary; scp it anywhere it runs. Same artifacts ship to npm and to
the Releases page (build-once-ship-everywhere CI), so the npm and
direct-download paths produce byte-identical binaries.
# 1. Start everything: proxy + watcher + dashboard in one foreground
#    process (ctrl-c to stop). Hooks auto-register for every detected
#    AI tool, and the dashboard opens in your browser
#    (http://localhost:8081; suppress with --no-open).
observer start

# 2. (another shell) Backfill from existing session logs so the
#    dashboard has history immediately rather than starting empty.
observer scan
From here the dashboard drives. On an empty database the Overview tab
leads with a three-step onboarding checklist — and a demo mode
offer if you'd rather look around first: one click seeds a temporary
synthetic dataset so every chart renders with realistic data (your
real observer.db is never read or written; a persistent banner marks
demo state and one click clears it). The two checklist steps that
matter:
env.ANTHROPIC_BASE_URL entry
in ~/.claude/settings.json; Codex: an observer model provider
in ~/.codex/config.toml) and writes only on confirm. Durable —
every later session routes automatically. The same section of the
Settings → Connected tools panel offers a per-tool setup wizard
(hooks / MCP / routing, one consent click per write) and a Launch
button. Prefer the terminal? The same routing ships as observer init, as session-scoped wrappers (observer claude / observer codex — no config writes), or as a plain
export ANTHROPIC_BASE_URL=http://localhost:8820 /
OPENAI_BASE_URL=http://localhost:8820/v1.Optional — MCP registration. observer init additionally writes
MCP server entries (and hook entries) into each AI tool's own config
files (~/.claude/settings.json, ~/.claude.json,
~/.cursor/mcp.json, ~/.codex/config.toml, …). Hooks default ON,
MCP defaults ON; opt out per-side with --skip-hooks / --skip-mcp.
Idempotent. observer start alone never registers the MCP server —
MCP wiring is explicit-only, because it costs ~1,800 schema tokens
per AI-client turn.
If you route Claude Code while MCP servers are registered, set
ENABLE_TOOL_SEARCH=true in the same environment. Claude Code's
SDK disables ToolSearch:optimistic deferred MCP loading whenever
ANTHROPIC_BASE_URL is set, eagerly inlining all 17 observer MCP
tool schemas (plus any Google MCPs) into every request prefix —
~+21K tokens/turn. The override re-enables lazy loading; observer's
proxy forwards tool_reference blocks byte-identically, satisfying
the SDK's documented safety condition. Empirical: with the override +
v1.7.23 defaults, the proxy is −6.9% mean cost vs no-proxy on
Claude Code's reference rig (n=8 lumen refactor task, V7-22 binary).
Without it, ~+9% per-turn overhead. See
superbased.app/docs/connect/claude-code
for the full picture.
The proxy logs every turn with the exact token counts the provider returned, including cache-tier breakdowns (5m vs 1h ephemeral) and 1h surcharges that JSONL adapters can't always disambiguate.
observer doctor          # health checks: DB integrity, hook
                         # registration, MCP entries, pid bridge
observer status          # row counts + recent activity
observer tail            # live-stream captured actions
observer start opens the dashboard automatically on interactive
launches (suppress with --no-open; default URL
http://localhost:8081). Twenty-one tabs in four nav groups (Monitor /
Analyze / Optimize / Configure), each designed around one question —
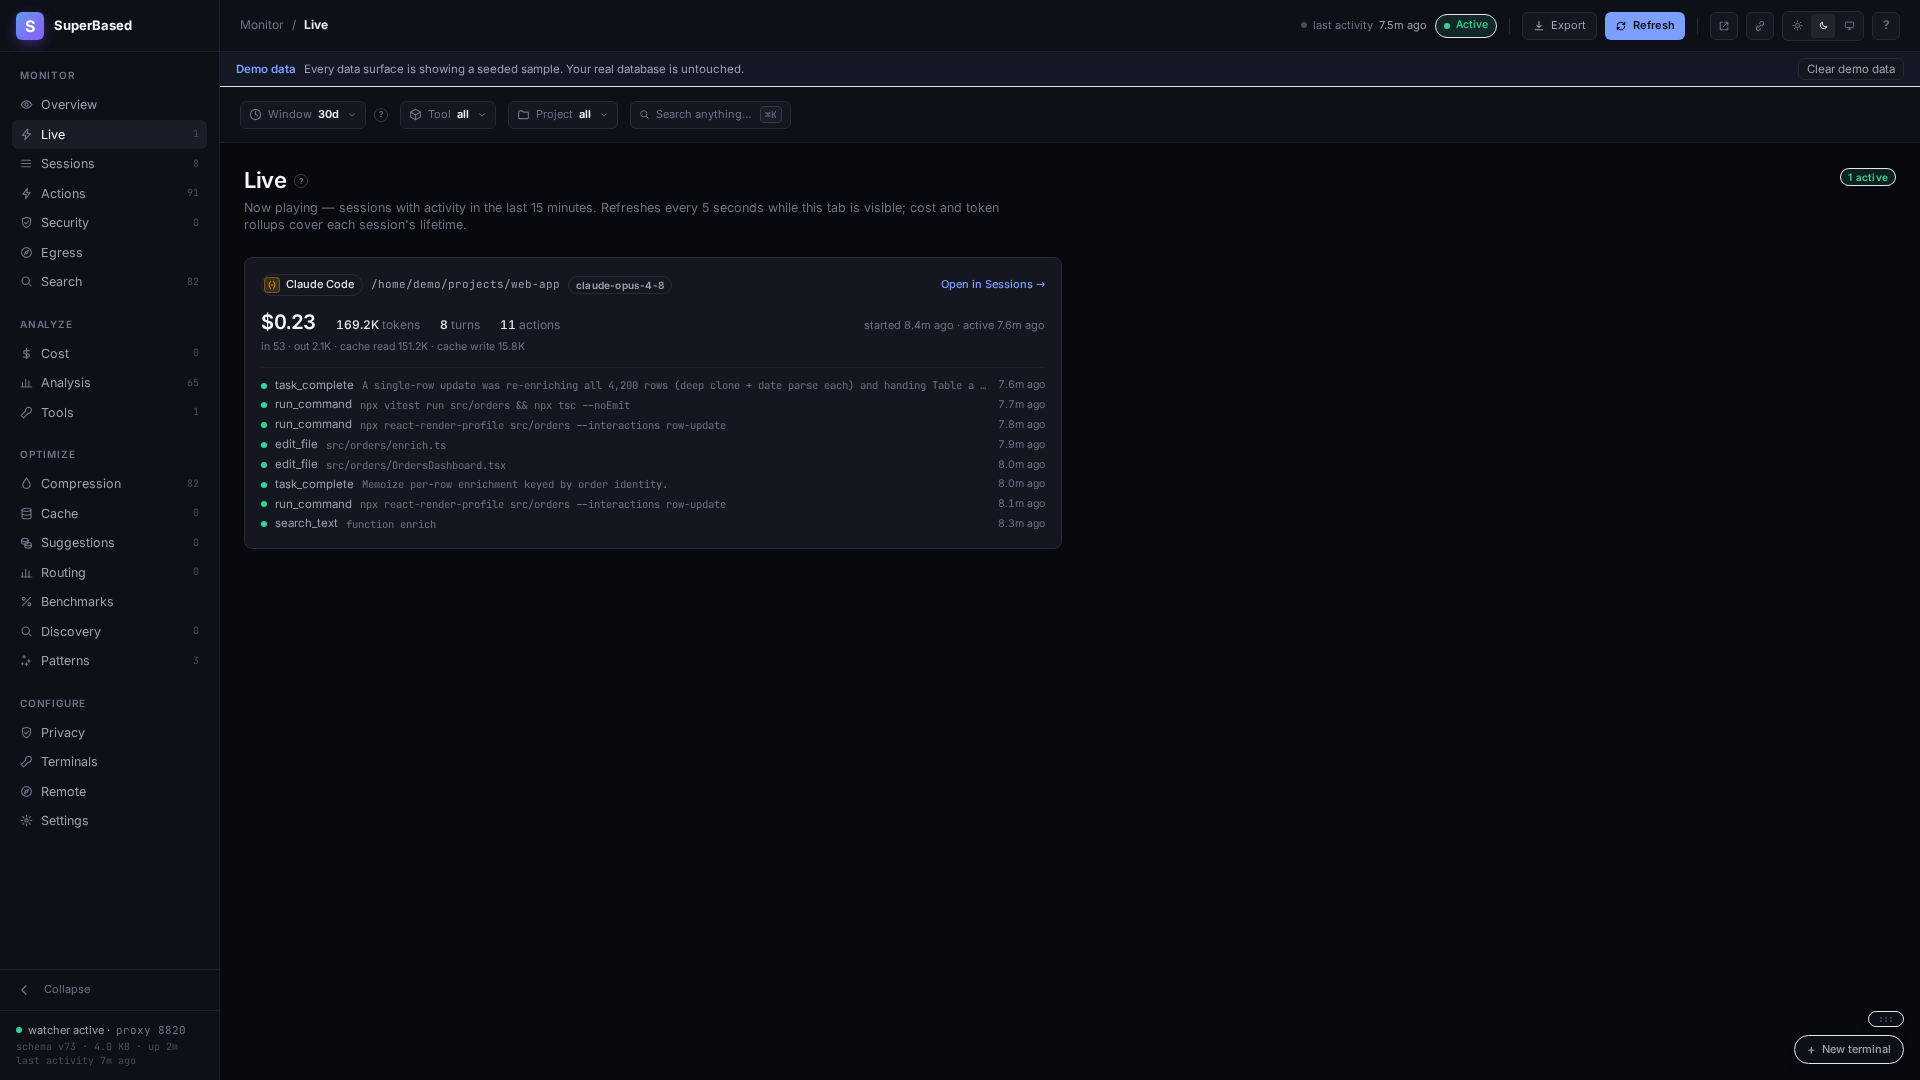
the tour below covers the core surfaces; Live (recent sessions with a
real-time action feed), Search (full-text over captured tool outputs),
Privacy (capture map + scrub tester), and the opt-in Terminals page
(covered in Terminals
below) and Remote page (covered under
Remote & mobile access below) are
self-explanatory once you're in, and the Suggestions tab's advisor
nudges and the Patterns tab's derived habits are covered in their own
docs. Evaluating without data? Start demo mode from the empty
Overview — synthetic dataset in a temp DB, real observer.db
untouched, one click to clear.
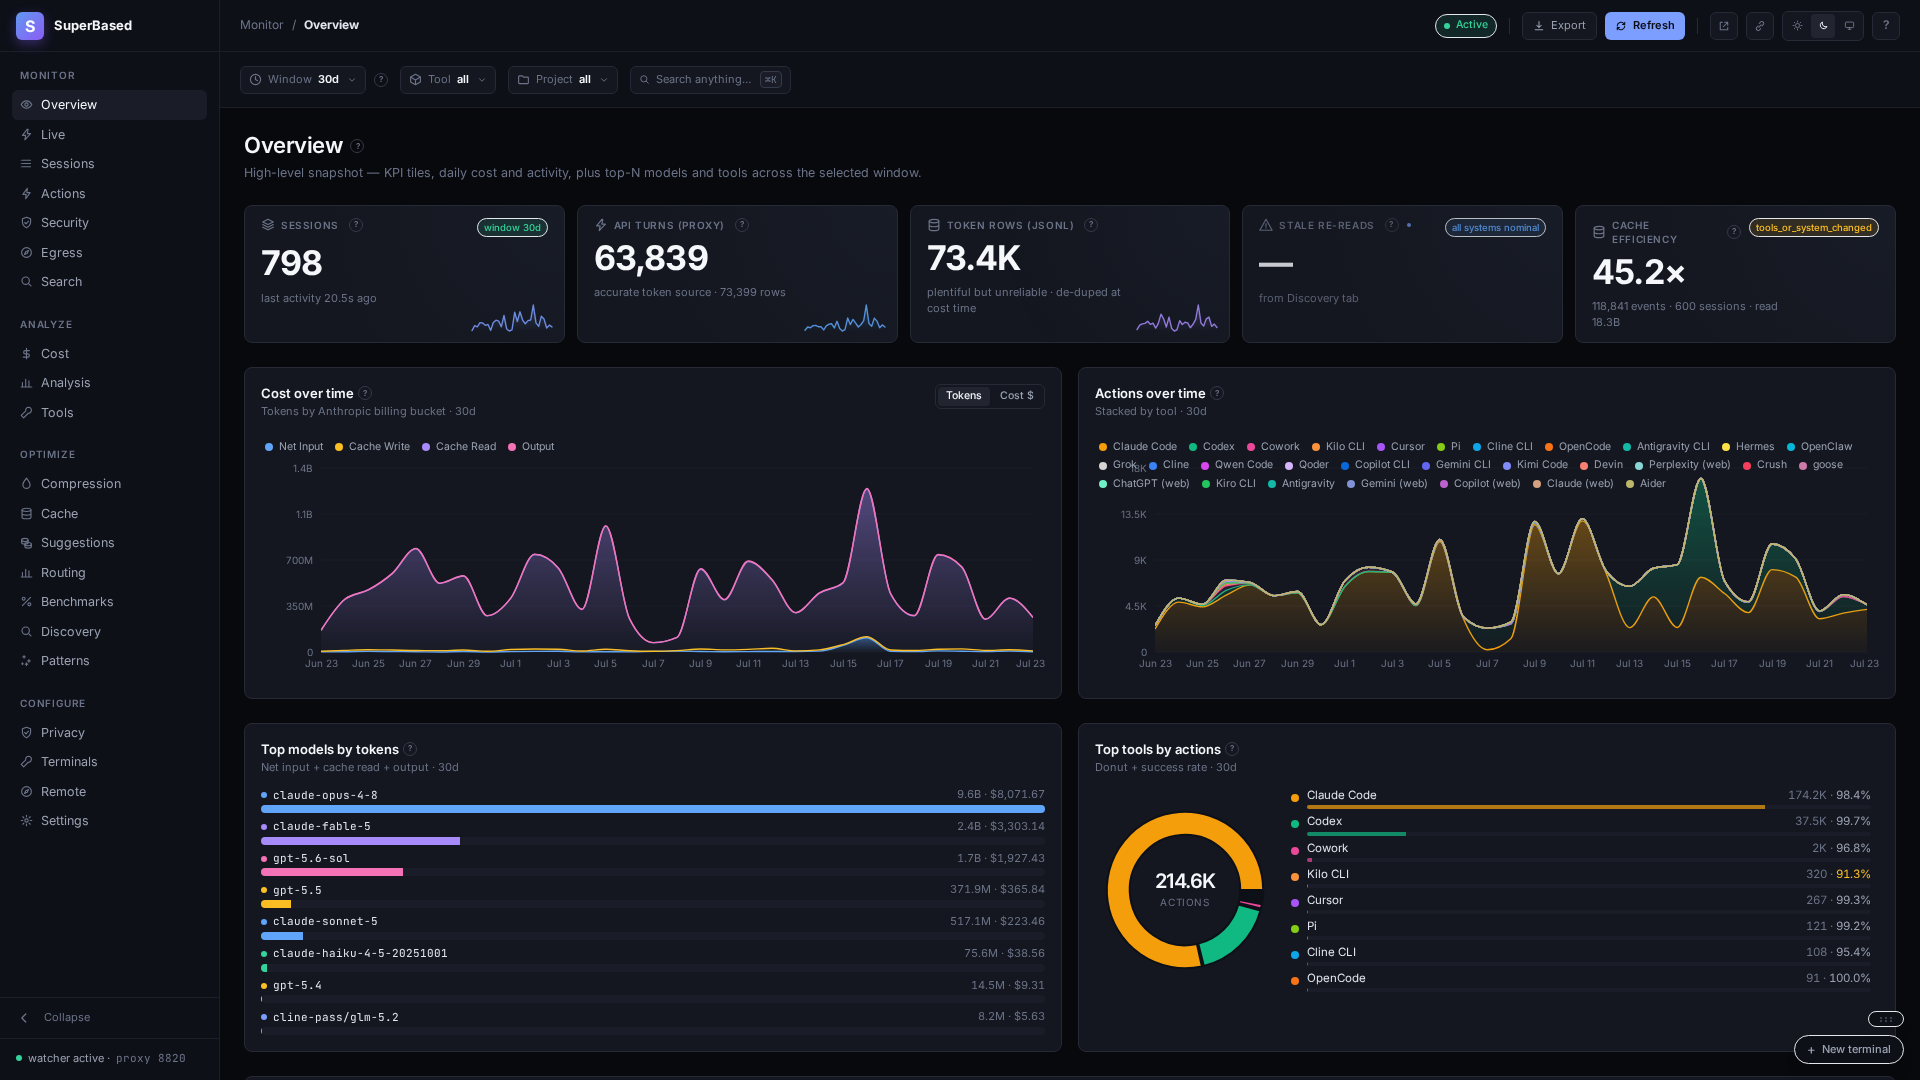
Four headline KPI tiles (sessions, API turns, token rows, stale re-reads — each filterable by the global Window / Tool / Project chips), cost-over-time stacked area split by billable token bucket, actions-over-time stacked by tool, top models by token volume, top tools by action count.
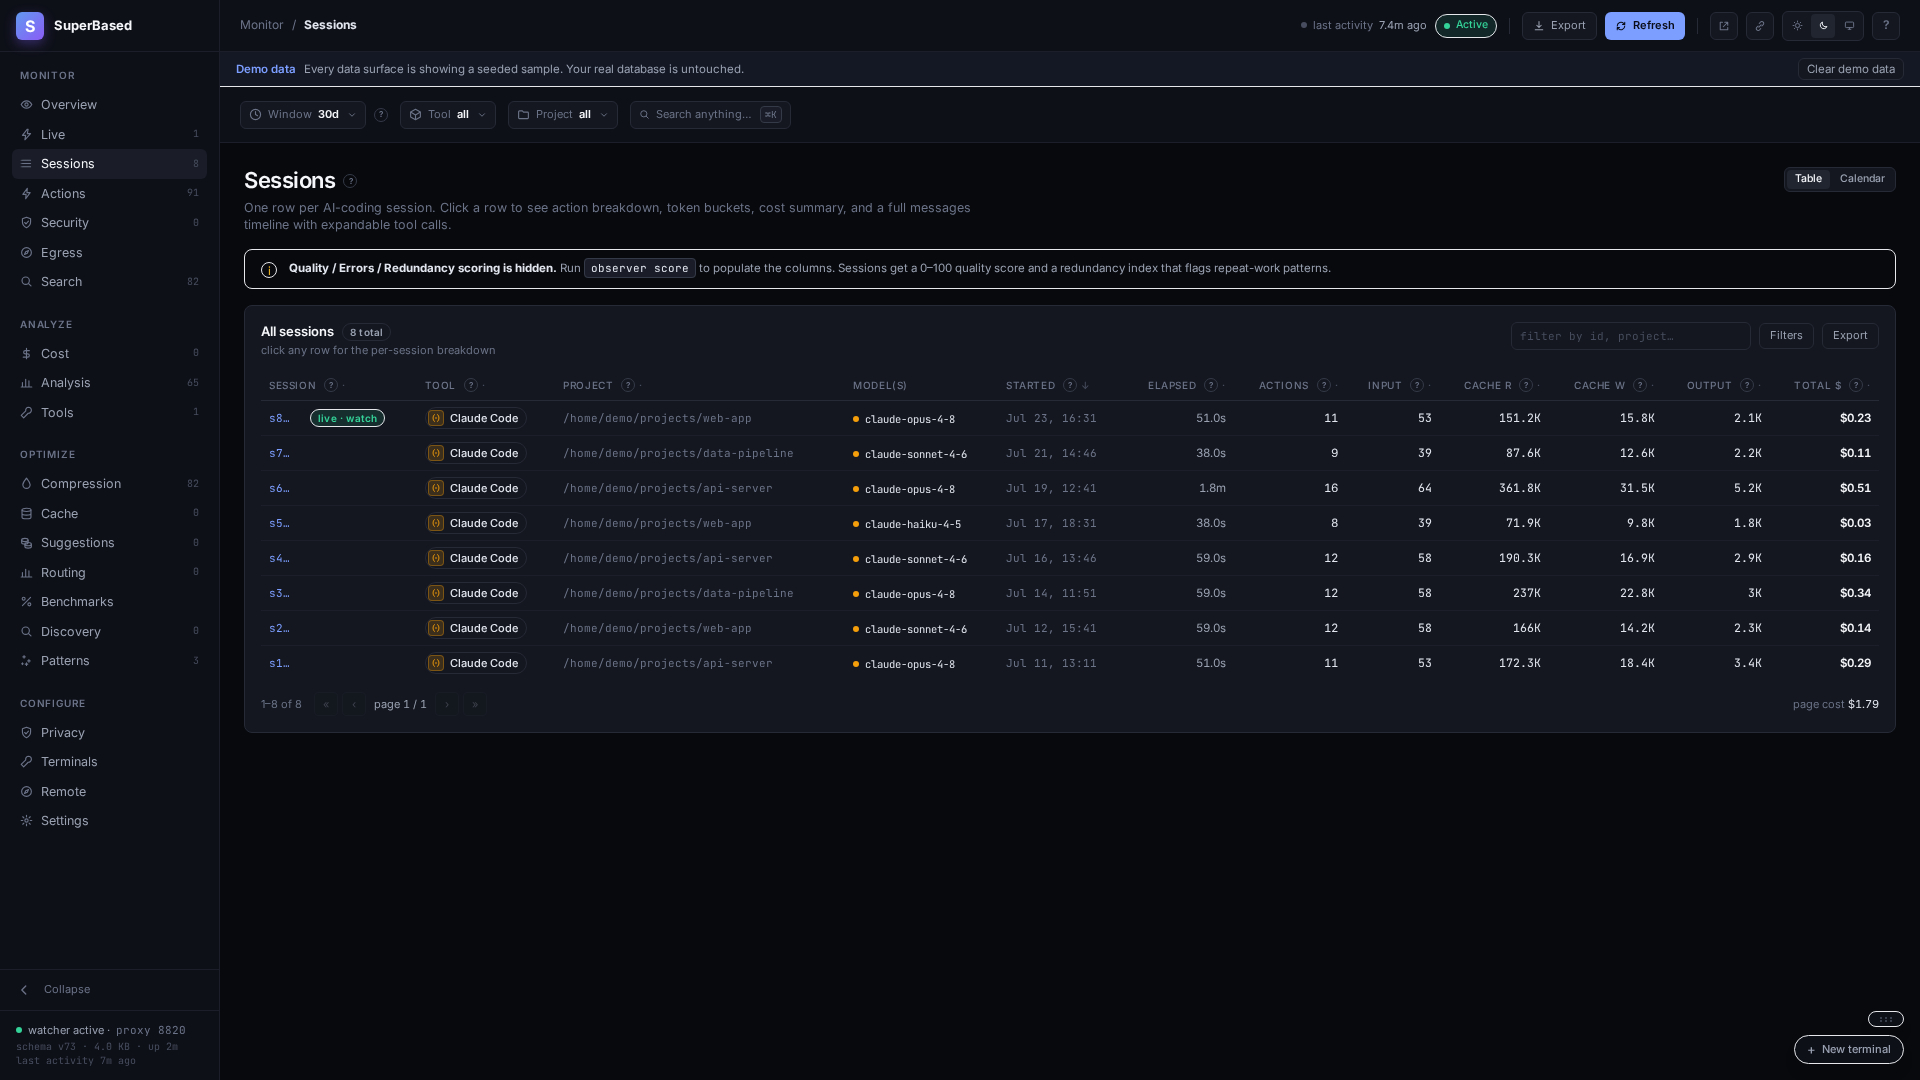
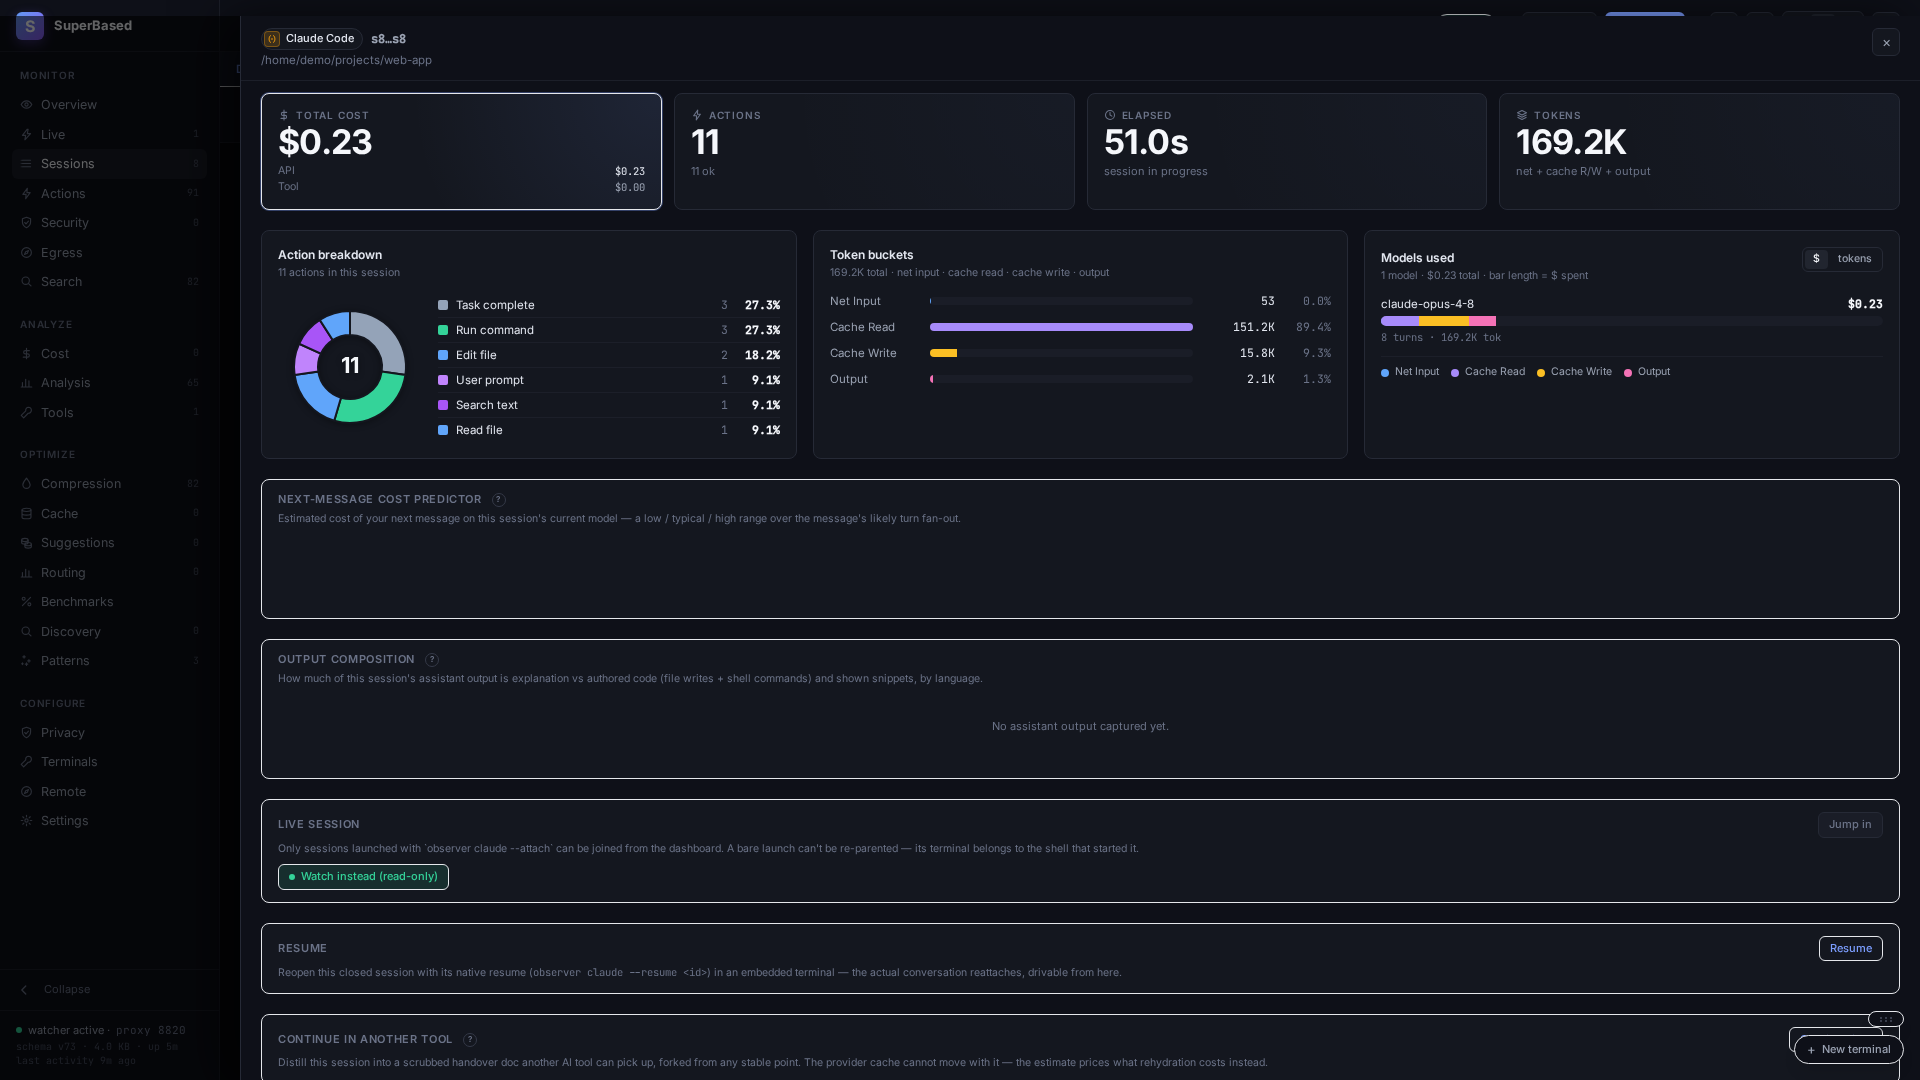
One row per session with cost, token totals (input / cache R /
cache W / output), elapsed time, action count, and a model badge.
Quality / Errors / Redundancy scoring columns light up once
observer score has run. Click a row to open the per-session
slide-over (shown below in Session detail).
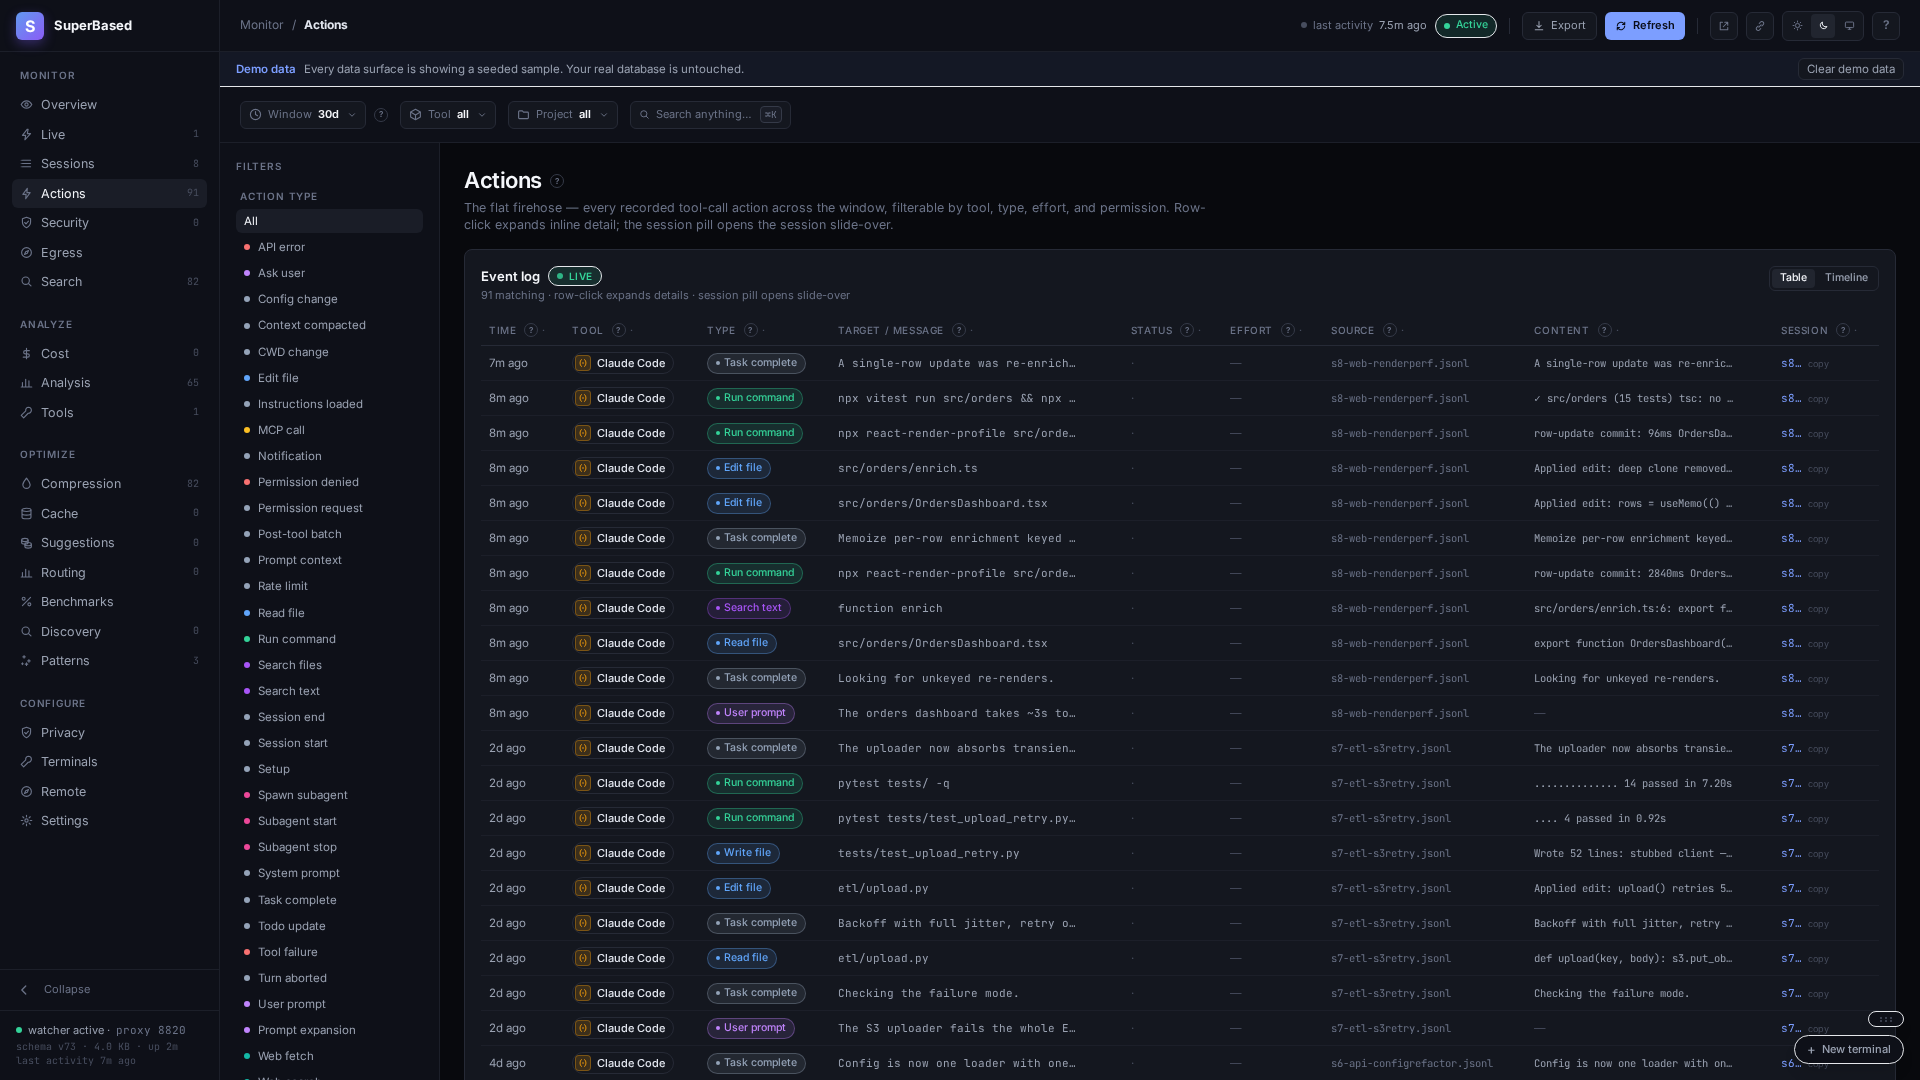
Every recorded tool call, normalized across adapters. Filter by
action type (28 categories), tool, effort, permission. Each row
exposes its target + status + raw-tool source + truncated content
preview; click to expand to the full event with error context.
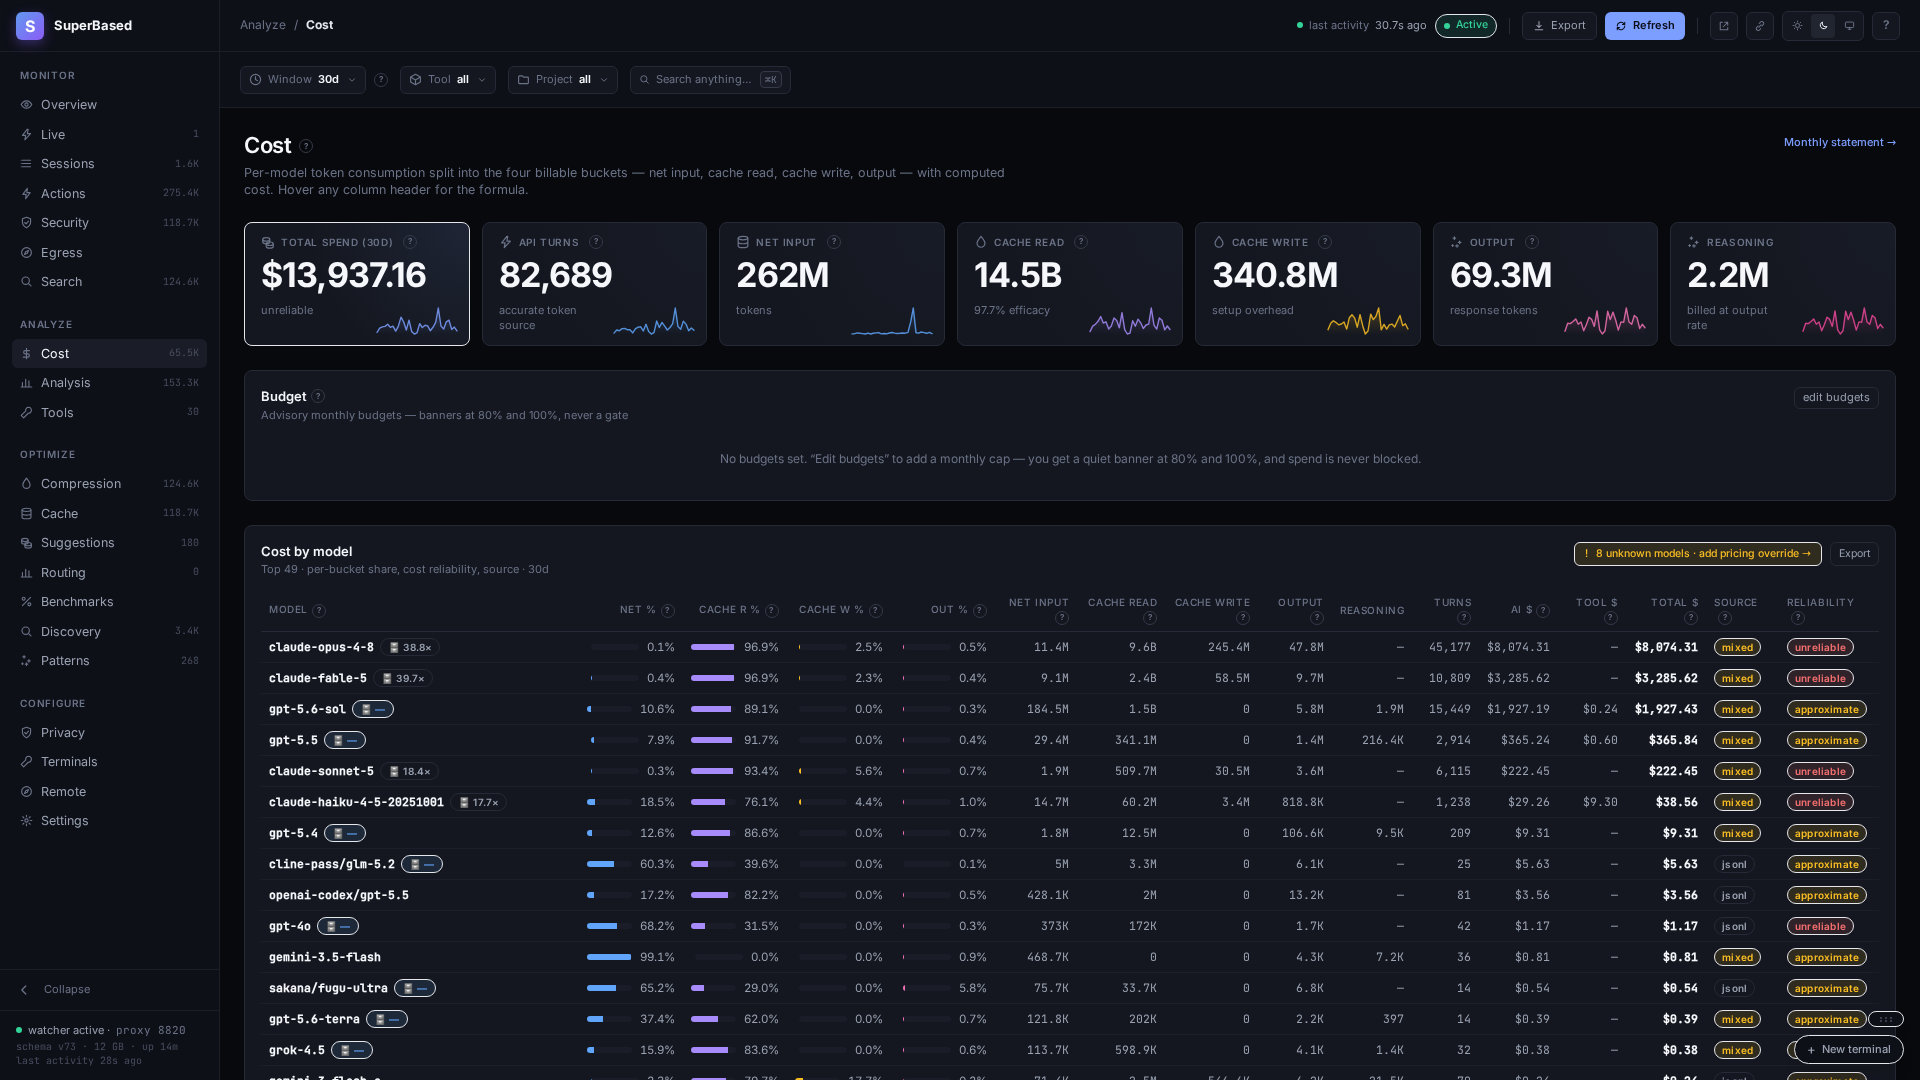
Eight KPI tiles across the billable token buckets (Net Input, Cache Read, Cache Write 5m, Cache Write 1h, Output, Reasoning, plus total USD and turn count). Per-model table shows the full breakdown including reasoning tokens (billed at output rate) and long-context surcharges (Sonnet 1M, gpt-5 >272K, Gemini 2.5 Pro >200K). Hover any column header for its definition + formula.
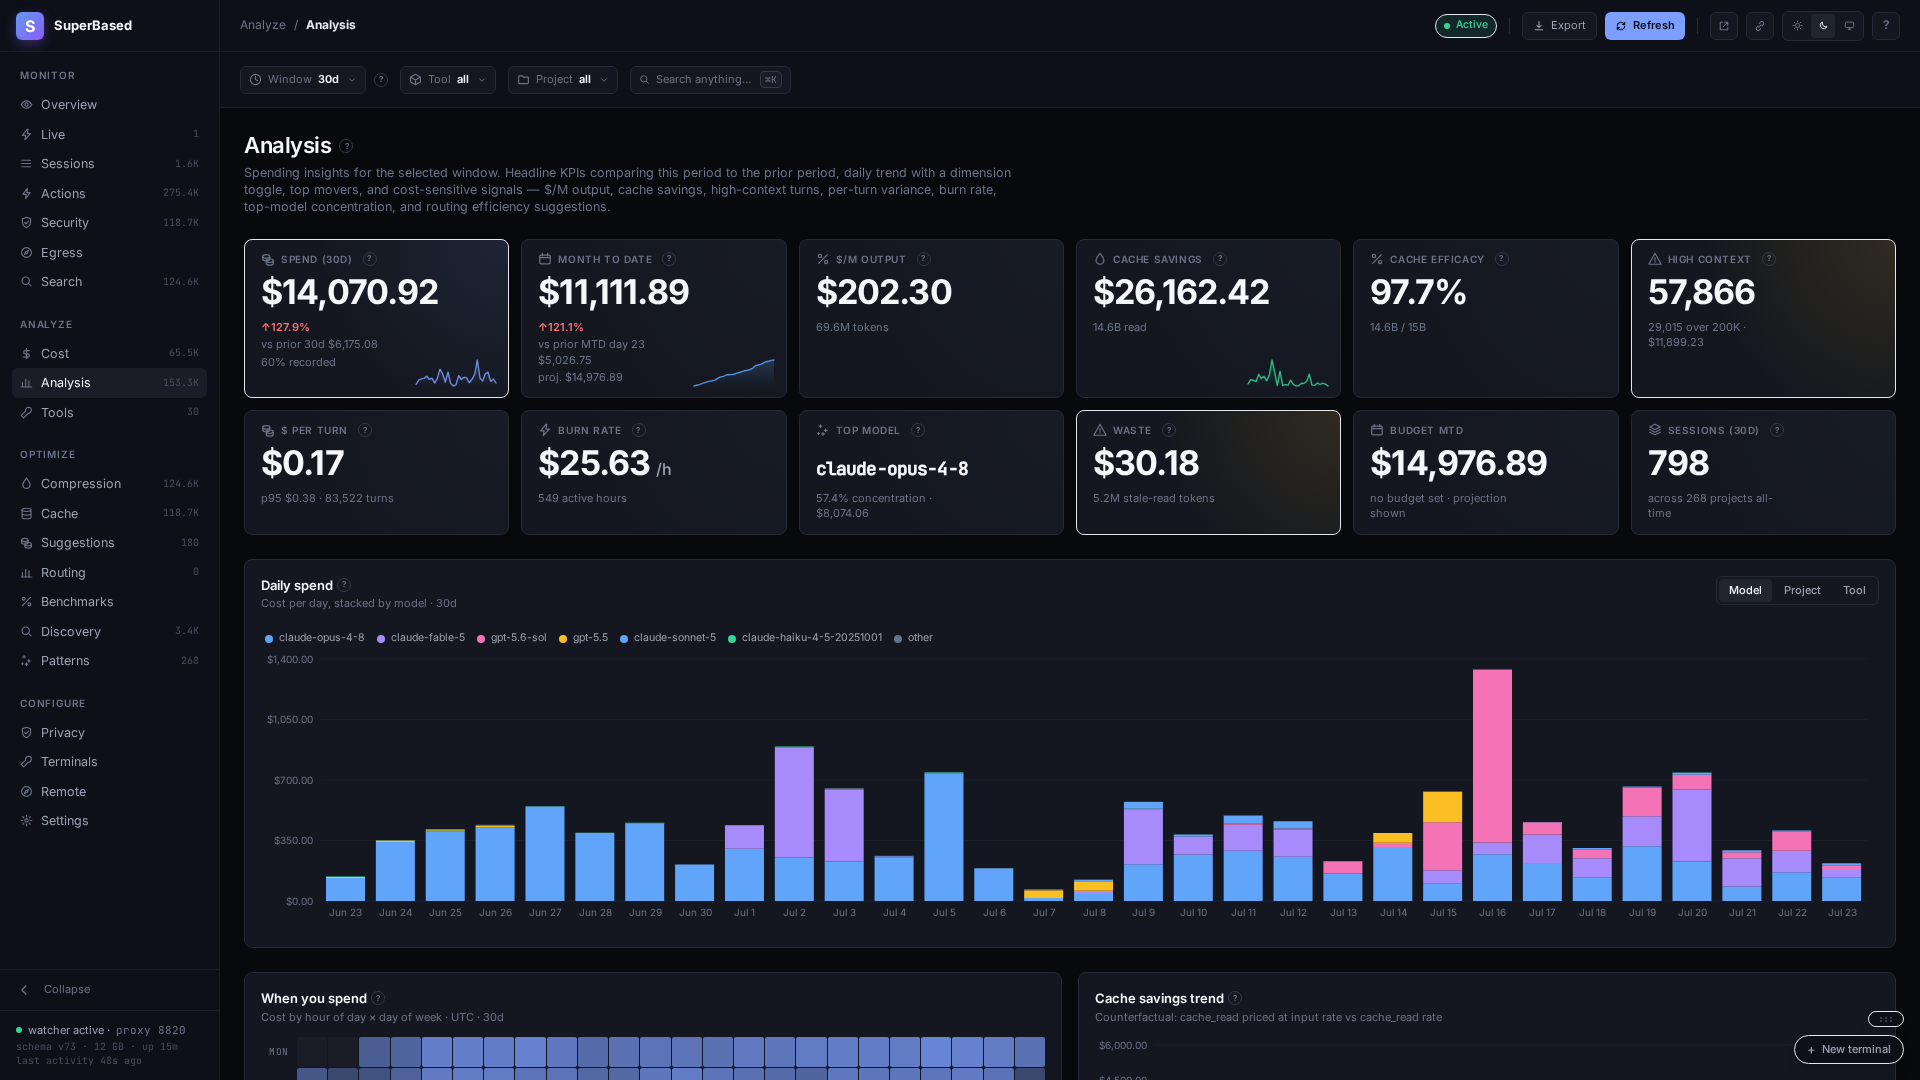
Twelve KPI tiles comparing this period to prior: spend Δ%, MTD vs budget with projection bar, $/M output rate, cache savings + cache efficacy %, high-context turn count, $/turn, burn rate ($/active hour), top model concentration %, Discovery waste $, sessions total. Daily-spend stacked bars with Model / Project / Tool dimension toggle, hour-of-day heatmap, period-over-period movers (top increases / decreases / new entrants), and model right-sizing hints (trivial Opus sessions that could have used Sonnet).
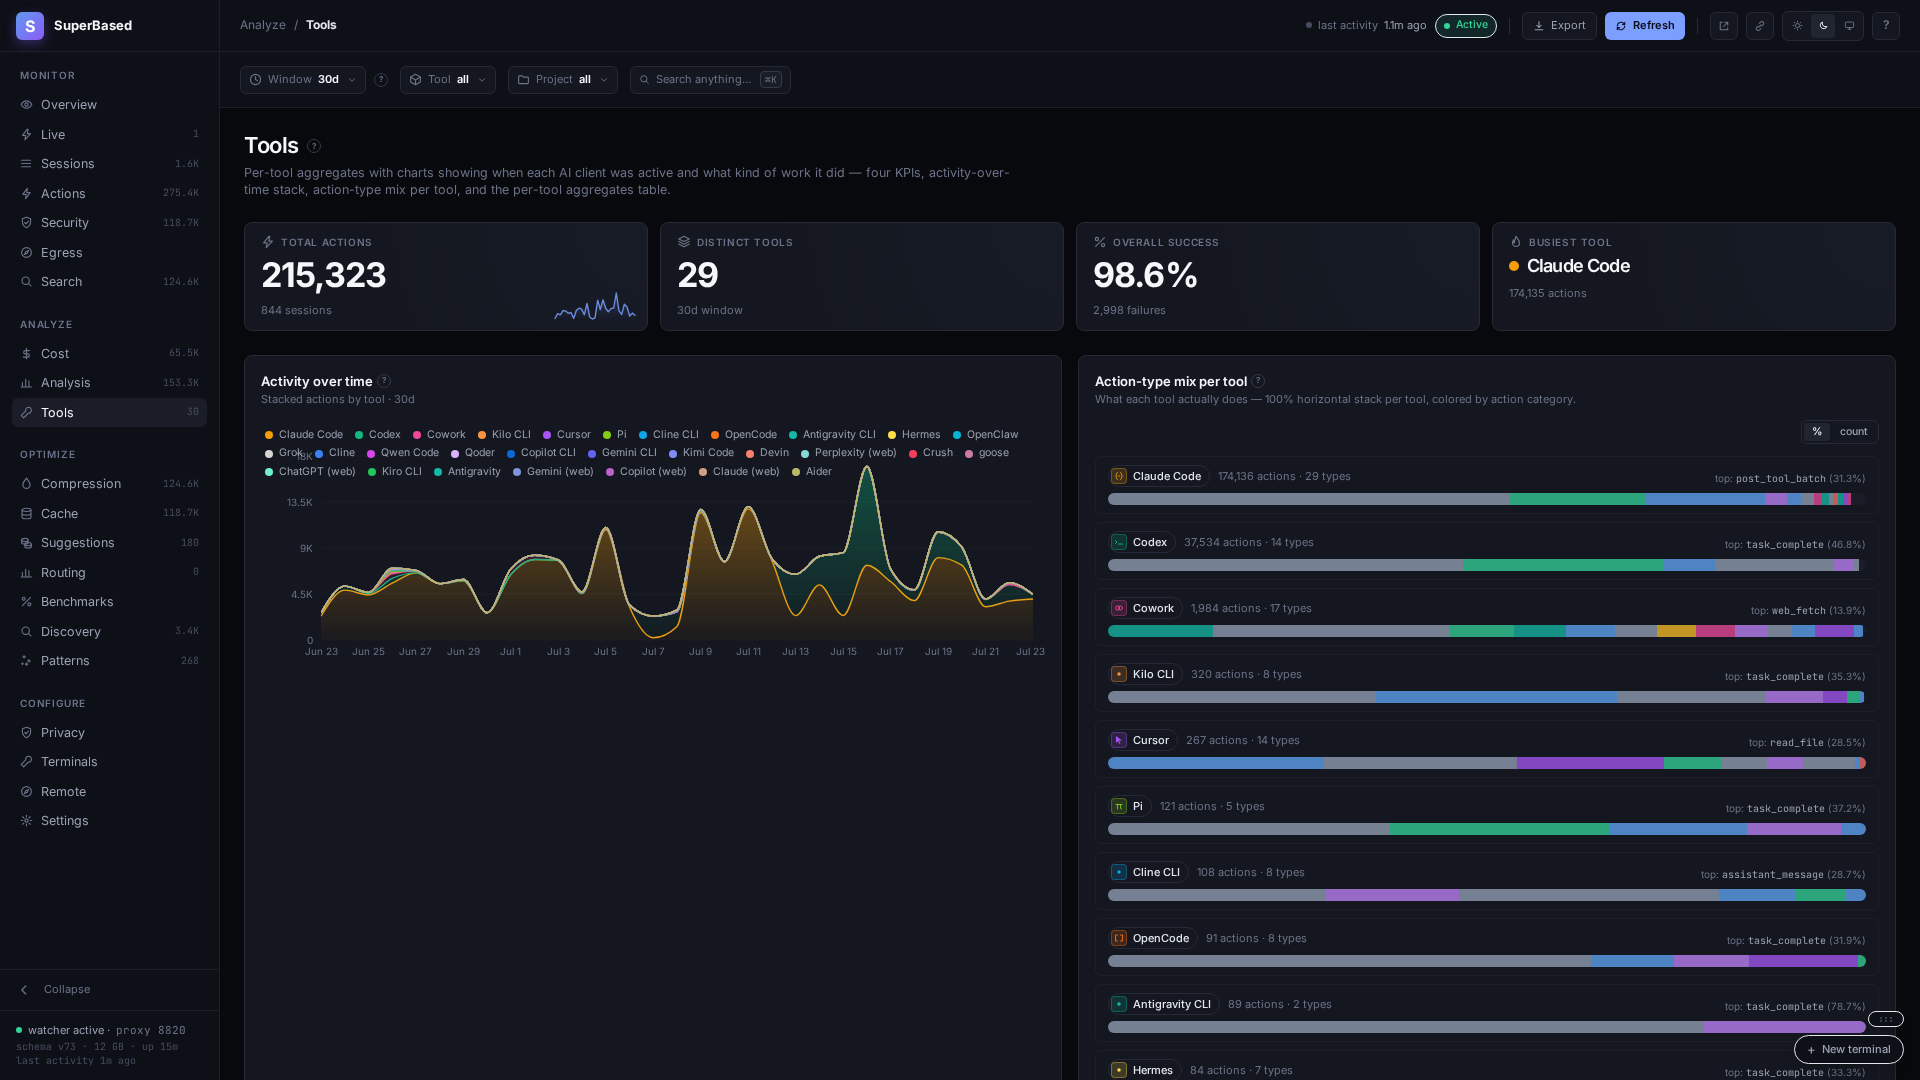
Four KPIs (total actions, distinct tools, overall success rate, busiest tool), activity-over-time stacked area, and per-tool action-type-mix horizontal bars (100% normalized, colored by action category). Surfaces which AI client owned which kind of work.
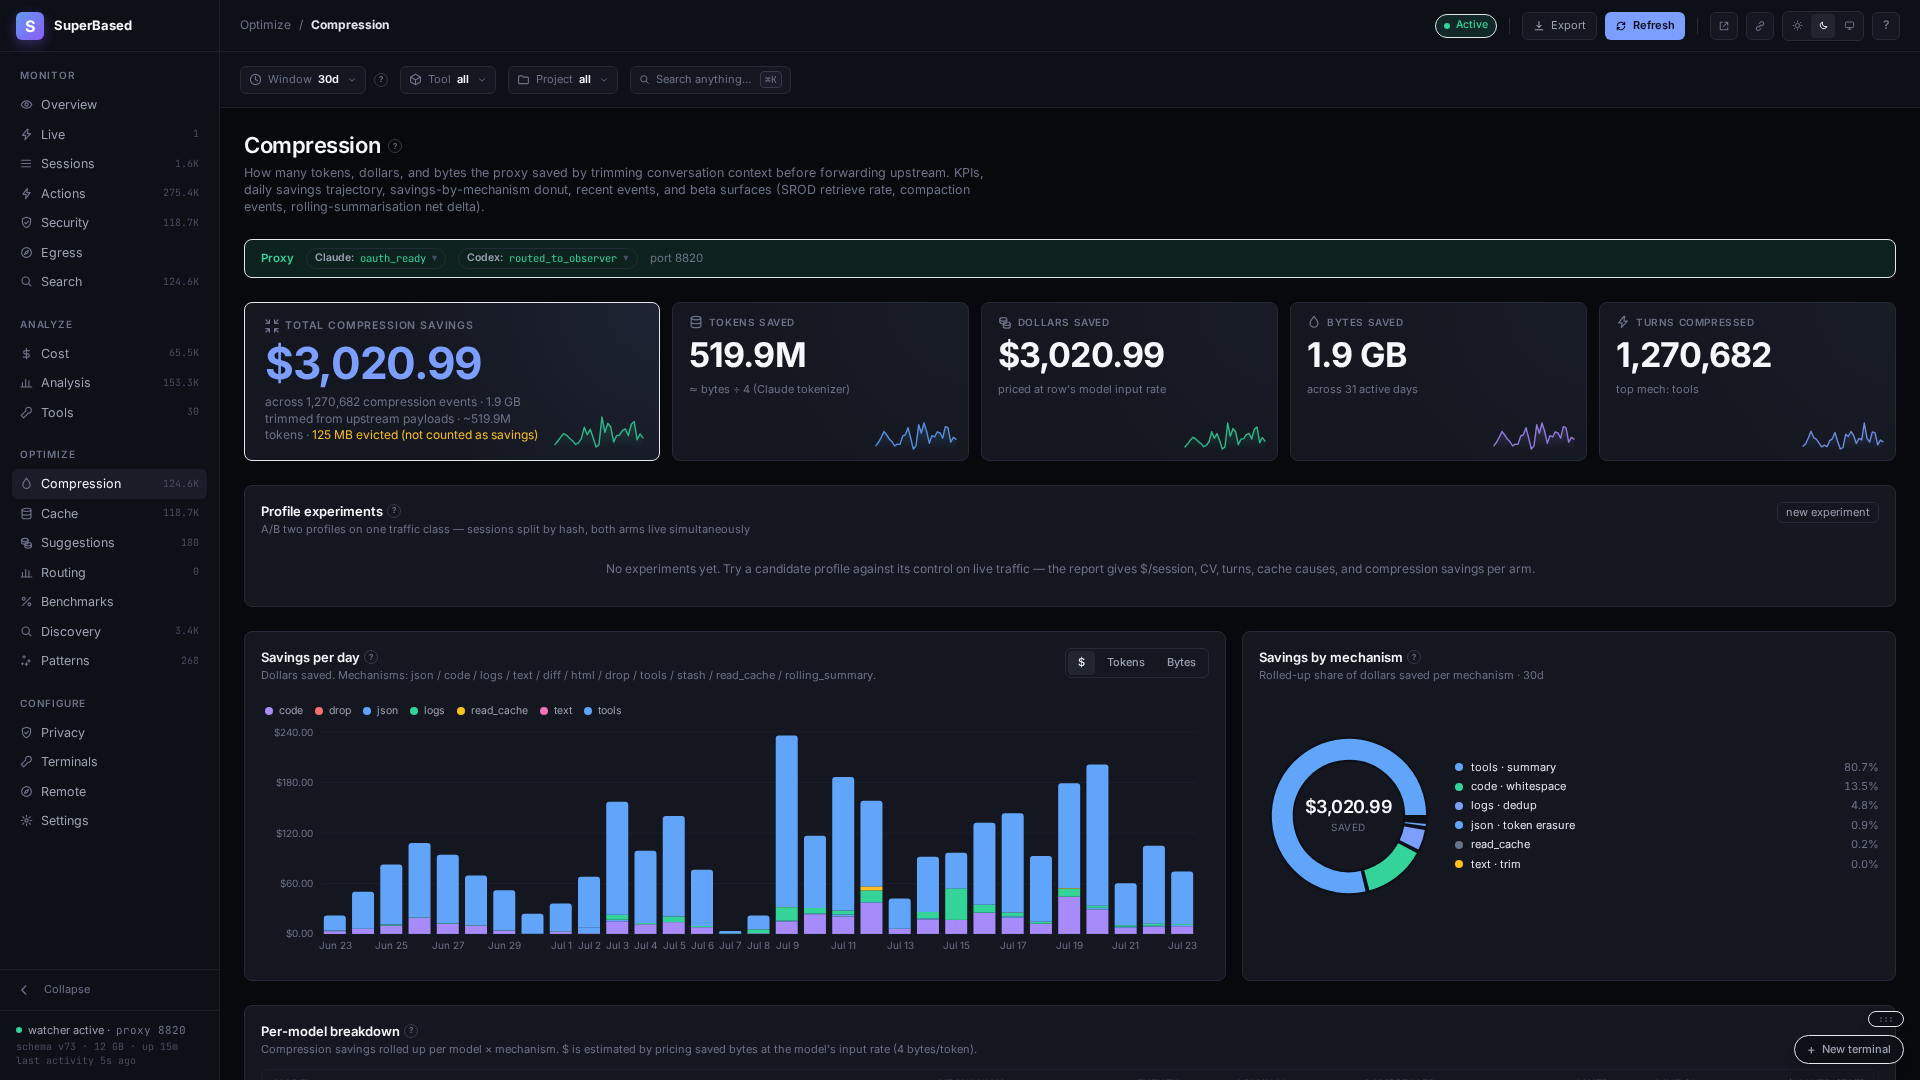
Five KPIs: total $ saved (priced at your input rate), tokens saved, bytes trimmed, turns compressed. Savings-per-day stacked bar by mechanism (drop, trim, summary), savings-by-mechanism donut, recent events table with original→compressed→saved + dollar impact per event.
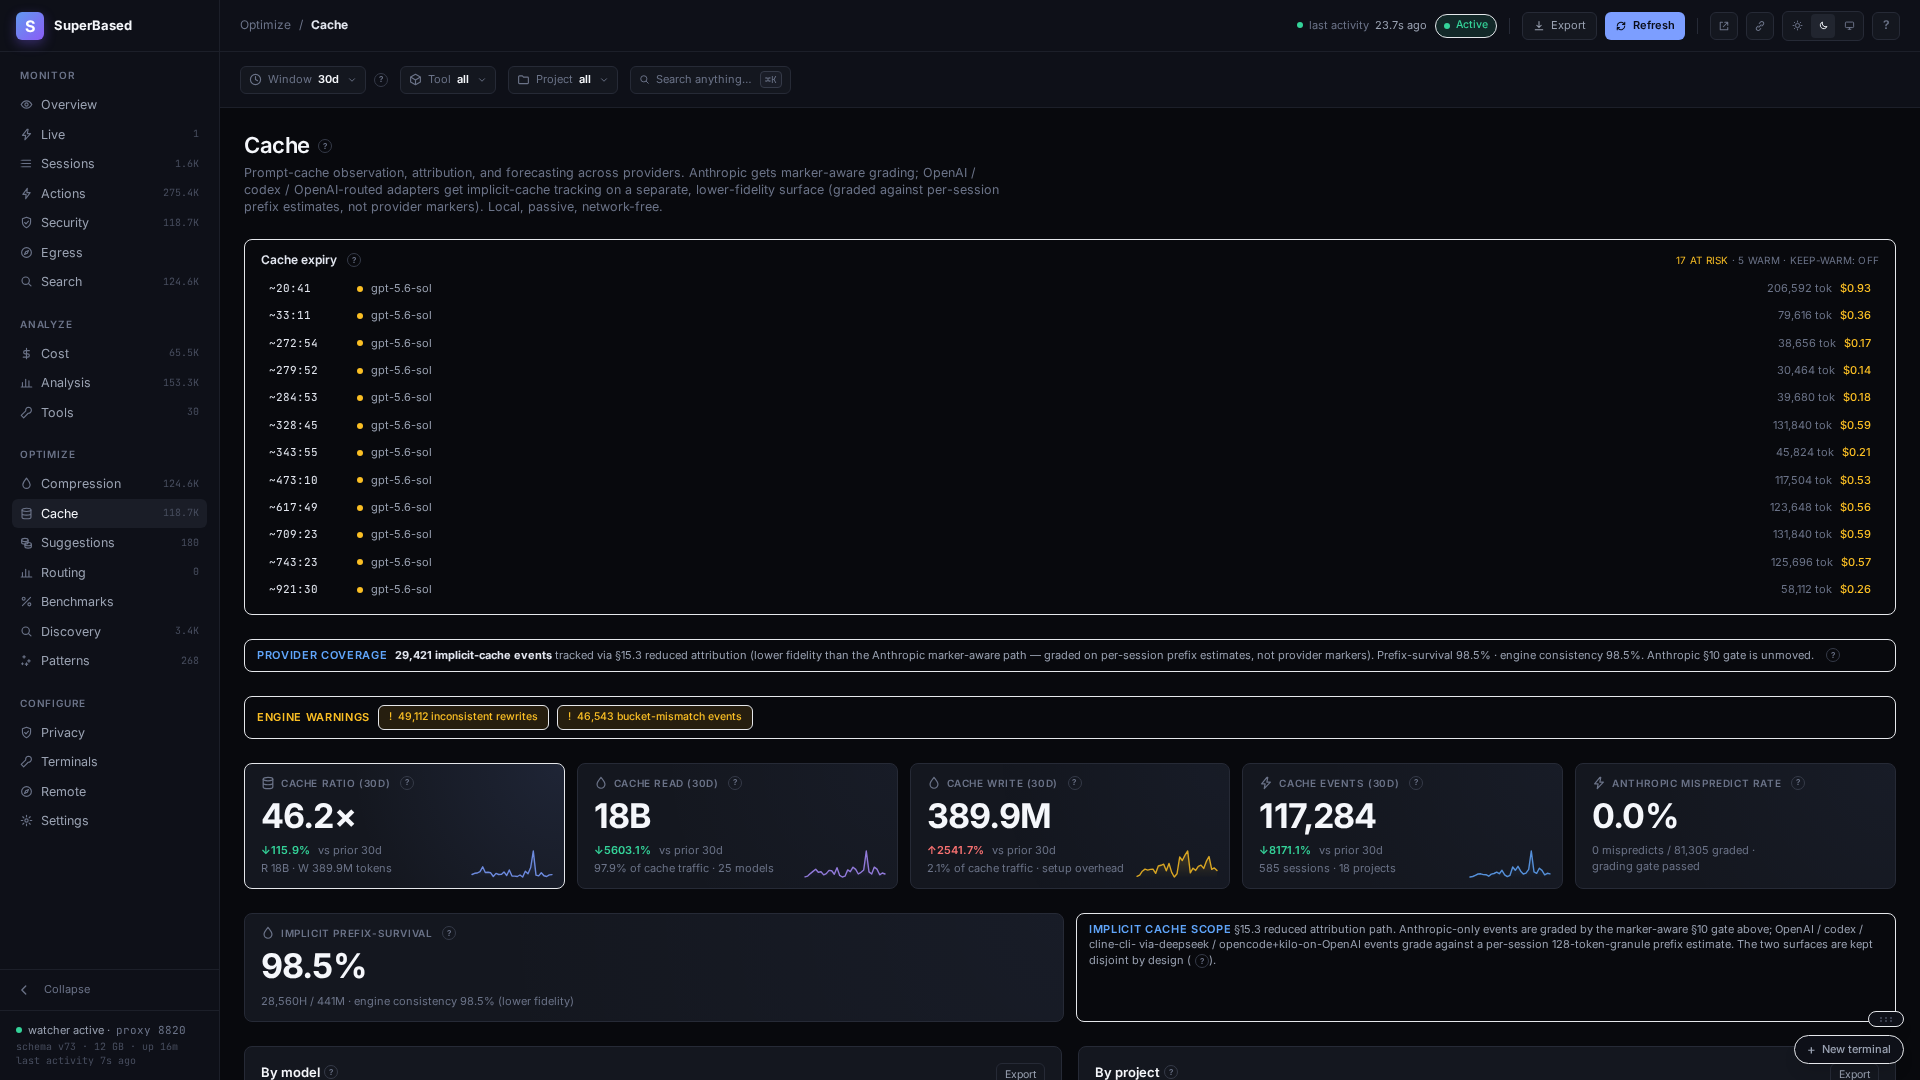
Headline cache-ratio hero (cache_read ÷ cache_write tokens) and three sibling KPIs: Cache read, Cache write, and Avoidable spend / Event count. Avoidable spend renders in warn tone — it's the dollar overhead of rewrites that wouldn't have happened on a perfectly cache-friendly session. By-model and By-project tables with R%/W% mix bars + absolute Read/Write/Events + cache Ratio + Avoidable $. Proportional Top causes histogram (suffix_growth + hit dominate a healthy session; real invalidations render in warn tone; tools_changed on MCP toggles renders neutral). Worst sessions table sorted by rewrite count; click-through opens the per-turn Cache panel.
How it's captured. Two paths feed the same engine, both writing
to NODE-LOCAL cache_segments / cache_entries / cache_events
tables (migrations 036+037, node-local only, never leaving the machine):
127.0.0.1:8820 and
the cachetrack engine reads each turn's cache_read_input_tokens +
cache_creation_input_tokens envelope live. Default capture path
for Claude Code.observer backfill --cache-rescan
to retrofit history.Enable / disable. Default-on per spec §11 (the loader merges
[cachetrack].enabled = true if the section is absent). To turn off:
[cachetrack].enabled = false in ~/.observer/config.toml, then
restart observer start. Inspect engine health with
observer cache-health --json. Operator reference:
superbased.app/docs/guides/cache-tracking
(or docs/cache-tracking.md in the repo).
Default-on, fully local suggestions engine (zero LLM cost, zero
network): 19 detectors turn the window's captured activity into
ranked, dollar- or minute-quantified recommendations — session
balloons, idle re-cache, long-context tier crossings, trivial
sessions on expensive models, cache hit-rate / cache-write waste /
prefix thrash, read-heavy expensive-model sessions, effort
overprovisioning, fast-tier premium, unrecovered failures, quality
regressions, MCP schema overhead, compression off, capture without
proxy routing, cross-session stale reads, web-search spend, spend
spikes, plus a posture nudge (guard observing idle, pointing at the
surface that owns the workflow). Every
card carries its arithmetic ("show math"), a confidence score,
snooze/dismiss with a 7-day cooldown, and — where a dashboard
control can fix the finding — a one-click action that navigates to
the right surface (writes stay behind that surface's own consent
flow). CLI twin: observer advise. Config: Settings → Advisor
([advisor] — evidence window, confidence/savings floors, opt-in
≤400-token session-start digest).
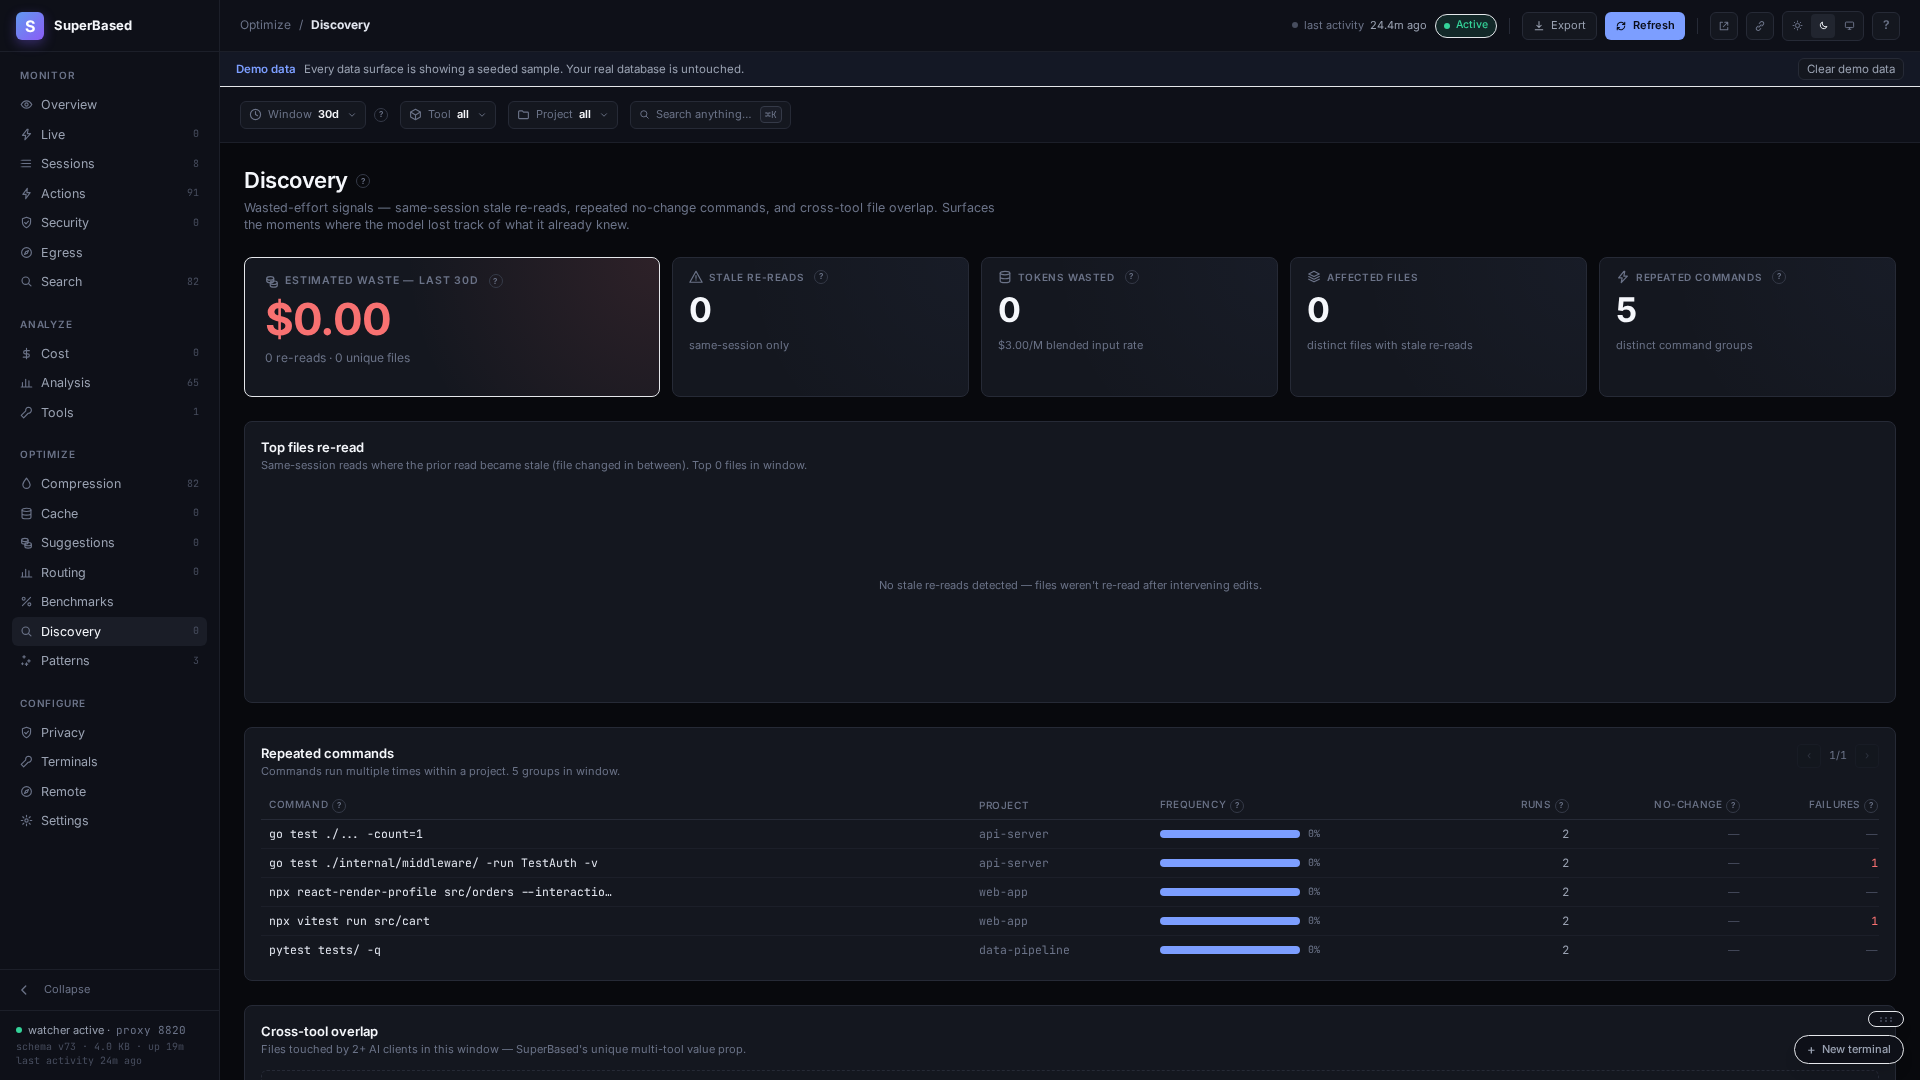
Waste $ hero (stale-read tokens × your blended input rate). Four KPIs: stale re-reads count, tokens wasted, affected files, repeated commands. Top files re-read table with cross-thread highlighting (when the same file was re-read from a subagent that didn't see the parent's read). Repeated-commands table with no-change-rerun detection.
Posture tiles + a filterable verdict timeline (rule IDs resolve to
their full definitions), then the routine workflows: a consent-gated
mode control that shows the simulate evidence before you flip
enforce, the enforce-readiness replay over your real history, the
approvals register (scoped, expiring — live immediately), a
lint-gated user-policy editor with .bak undo, budget guardrails
suggested from your own observed spend with a daily burn-down meter,
MCP pin approvals, and one-click compliance evidence downloads.
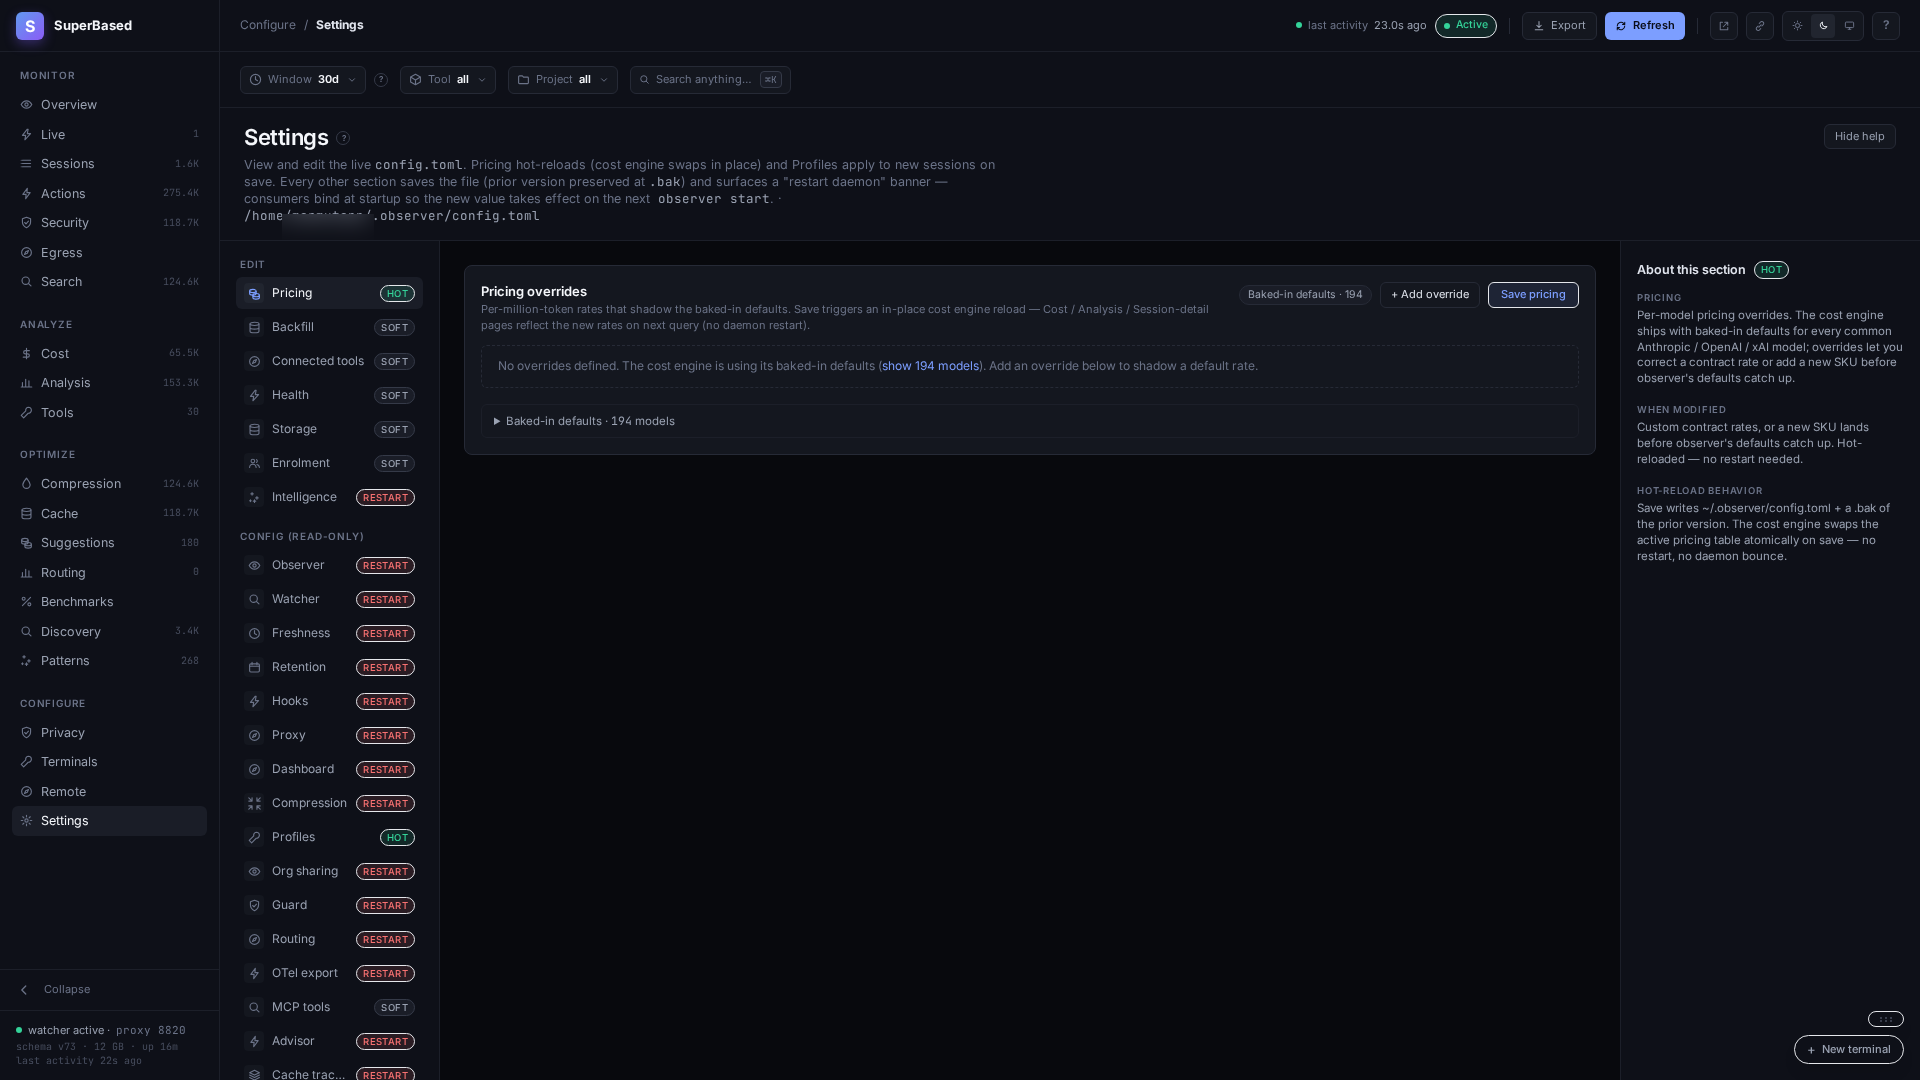
Schema-driven forms for every config section — Watcher, Freshness,
Retention, Hooks, Proxy, Compression, Intelligence, Advisor, Cache
tracking, Secrets scrubbing, MCP, Profiles, Org share, OTel — with
honest reload semantics per section: pricing and profile changes
apply hot, MCP applies to the next AI session, restart-gated
sections raise a persistent restart-pending banner that names the
exact command and clears only when the daemon actually restarts.
Alongside the forms: a Connected tools panel (per-tool status
matrix, consent-gated setup wizard, Launch button), a Health
panel (the observer doctor checks + recent failures), the
Backfill panel (every mode click-to-run with streamed output +
full rescan), a Storage panel (per-table DB size breakdown with
index/FTS bytes folded in, vacuum + online backup as click-to-run
jobs, documented manual restore — CLI twin observer db stats|vacuum|backup), and a config-file card with one-click .bak
restore.
182 baked-in default models; pricing "Override" prompts auto-fill
from the default.
Sign in to join the discussion.
No comments yet. Be the first to say what this is good for.
🪨 why use many token when few token do trick — Claude Code skill that cuts 65% of tokens by talking like caveman

The best-benchmarked open-source AI memory system. And it's free.

Orca is the ADE for working with a fleet of parallel agents. Run any coding agent with your own subscription. Available on desktop, mobile and remote runtime.
A cross-platform desktop All-in-One assistant for Claude Code, Codex, OpenCode, OpenClaw, Grok Build & Hermes Agent. Only official website: ccswitch.io

Never stop coding. Free MIT AI gateway: one endpoint, 352 providers (150+ free), 1200+ models Kimi, Claude, GPT, Gemini, GLM, DeepSeek, MiniMax. Works with Claude Code, Codex, Cursor, OpenCode, Cline & Copilot. Quota-aware auto-fallback, RTK+Caveman compression saves 15-95% tokens, MCP/A2A, Desktop/PWA. Built by 550+ contributors

Compress tool outputs, logs, files, and RAG chunks before they reach the LLM. 20% fewer tokens for coding agents, 60-95% fewer tokens for JSON, same answers. Library, proxy, MCP server.