

JuliusBrussee/
caveman

🪨 why use many token when few token do trick — Claude Code skill that cuts 65% of tokens by talking like caveman
105k
1 add
PAR CC Usage monitors Claude Code activity by reading its usage files and turning them into live token, cost, and session views. It also provides a Claude Code status line, reporting tools, theme settings, cache management, and webhook notifications.

Builders who use Claude Code and want a reusable way to watch usage, costs, and session progress.
You can see Claude Code usage and costs in real time instead of manually checking JSONL logs.
Shows live token usage, burn rate, progress bars, and time remaining for Claude Code projects.
Adds a Claude Code status line with token, message, cost, and remaining block time.
Generates daily, weekly, monthly, and all-time summaries with totals, averages, and P90 values.
Uses pricing data to calculate per-model costs, block estimates, and report output with pricing columns.
Supports multiple themes, compact mode, and configurable progress bar styles.
Manages config files, cache files, read-only mode, and legacy migration for Claude Code data.
Can send Discord or Slack webhook alerts when billing blocks complete.
uvx --from par-cc-usage pccu monitor
# or installing into the $PATH
uv tool install par-cc-usage
pip install par-cc-usage
pccu monitor
# Using uv
uv run pccu monitor

# Or using make (if available)
make run

# Or directly with Python
python -m par_cc_usage.main monitor
pccu install-statusline
# Clear file monitoring cache
pccu clear-cache

# Clear cache with custom config
pccu clear-cache --config my-config.yaml
Claude Code usage tracking tool with real-time monitoring and analysis.





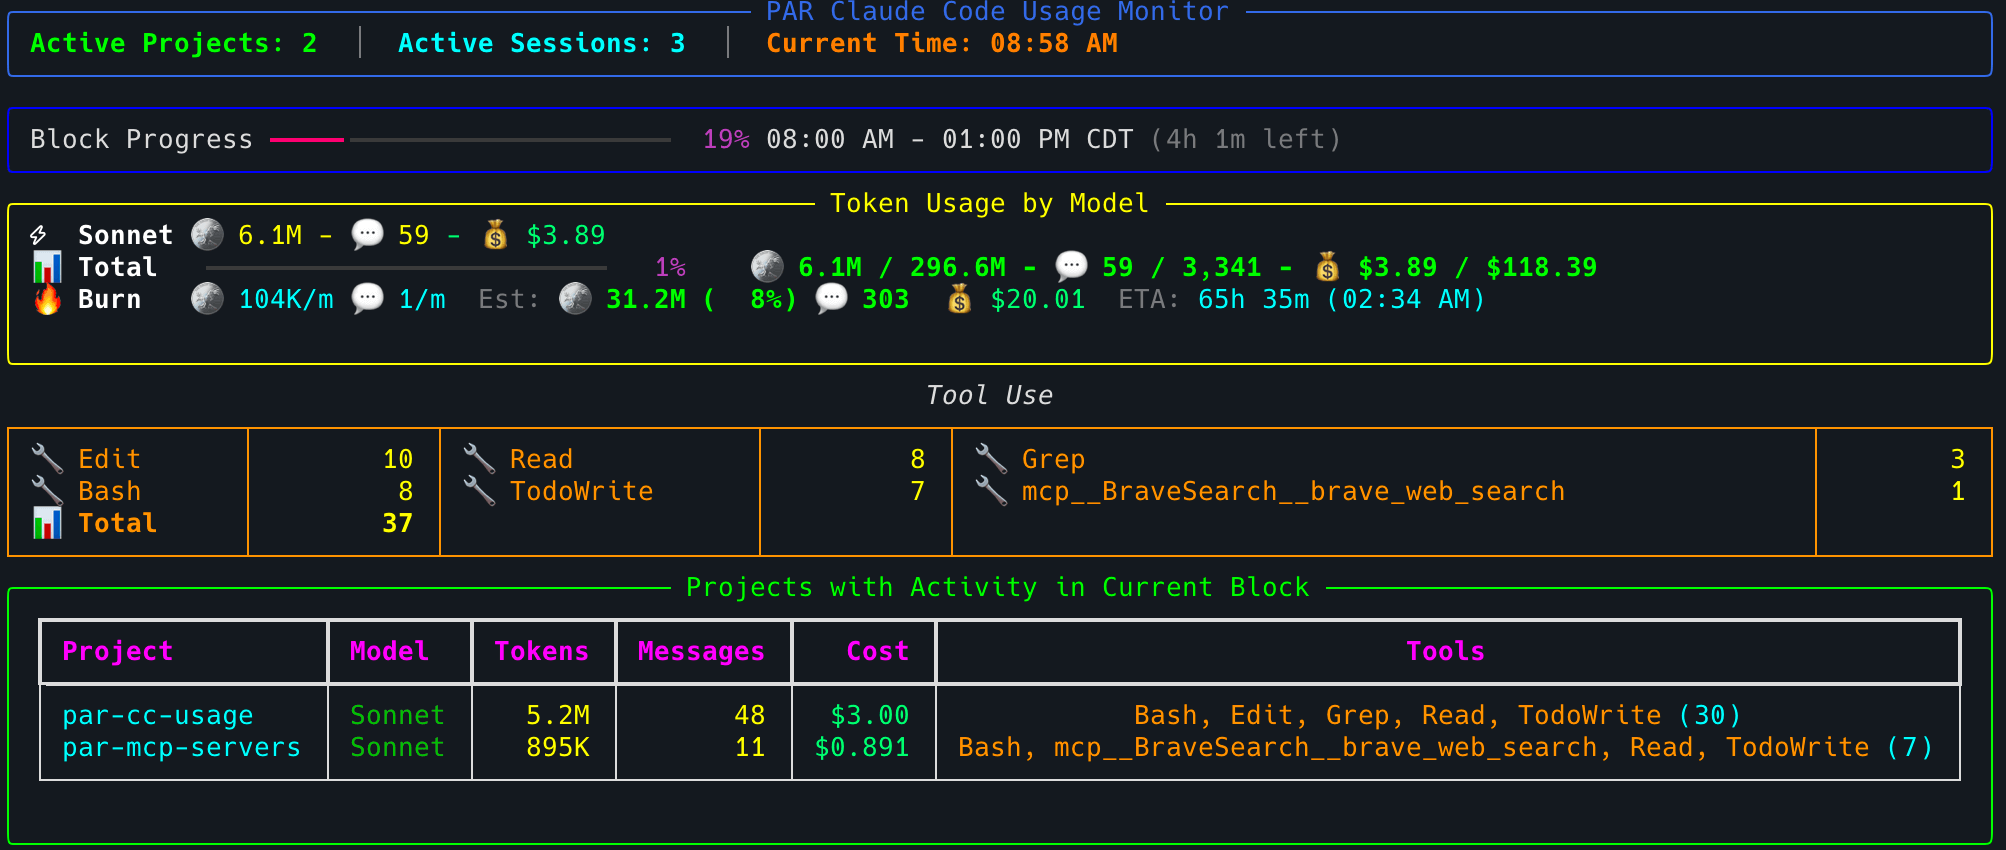 Real-time monitoring interface showing token usage, burn rate analytics, tool usage tracking, and project activity
--no-p90 flag or config setting--show-pricing--show-pricing and intelligent cost hierarchy~/.claude/projects) and new pathsupdate-maximums command automatically updates configuration limits based on actual usage patternspccu install-statuslinejsonl_analyzer.py tool for examining Claude Code data filesUsing uv (fastest):
uvx --from par-cc-usage pccu monitor
# or installing into the $PATH
uv tool install par-cc-usage
Using pip:
pip install par-cc-usage
After installation, you can run the tool directly:
pccu monitor
Clone the repository and install in development mode:
# Clone the repository
git clone https://github.com/paulrobello/par_cc_usage.git
cd par_cc_usage

# Install with uv (recommended)
uv sync

# Or install with pip
pip install -e .
Run the tool in development mode:
# Using uv
uv run pccu monitor

# Or using make (if available)
make run

# Or directly with Python
python -m par_cc_usage.main monitor
PAR CC Usage can display real-time token usage directly in Claude Code's status bar at the bottom of the interface.

Install the status line with a single command:
pccu install-statusline
This will automatically configure Claude Code to display your token usage. Restart Claude Code to see the changes.
If you prefer to configure manually, add this to your ~/.claude/settings.json:
"statusLine": {
  "type": "command",
  "command": "pccu statusline"
}
The status line shows (v0.9.0+):
Example: [parllama] - 🪙 495.7M/510.7M (97%) - 💬 736/1,734 - 💰 $155.27/$166.80 - ⏱️ 2h 8m
Status Line Behavior:
Important: The status line is updated when pccu monitor is running. For real-time updates, keep the monitor running in a terminal.
# Install status line into Claude Code
pccu install-statusline

# Install with force (skip confirmation prompts)
pccu install-statusline --force

# Remove status line from Claude Code
pccu uninstall-statusline

# Remove with force (skip confirmation prompts)
pccu uninstall-statusline --force

# Configure status line template
pccu configure-statusline
Control status line behavior in your config.yaml:
# Enable/disable status line generation (default: true)
statusline_enabled: true

# Always show grand total instead of per-session (default: false)
statusline_use_grand_total: false

# Progress bar customization (v0.10.0+)
statusline_progress_bar_colorize: true  # Colorize progress bars based on usage (green/yellow/red)
statusline_progress_bar_style: rich     # Style: 'basic' (blocks █░) or 'rich' (lines ━╺)
statusline_progress_bar_length: 15      # Length of progress bar (default: 15)
statusline_progress_bar_show_percent: true  # Show percentage in center of bar

# Custom status line template (advanced)
statusline_template: '{project}{sep}{tokens}{sep}{messages}{sep}{cost}{sep}{remaining_block_time}{sep} SES:{session_tokens}/{session_tokens_total}{sep}{session_tokens_progress_bar}'
{model} template variableThe status line automatically updates whenever you run pccu monitor, providing real-time usage feedback directly in your Claude Code interface.
Monitor token usage in real-time with comprehensive options:
# Basic monitoring (default 5-second interval)
pccu monitor

# Compact mode for minimal display
pccu monitor --compact

# Basic monitoring (sessions shown by default)
pccu monitor

# High-frequency monitoring with custom settings
pccu monitor --interval 2 --token-limit 1000000 --show-sessions

# Monitor with custom configuration
pccu monitor --config production-config.yaml

# P90 vs Absolute Maximum options
pccu monitor  # Default: P90 limits for stable progress bars
pccu monitor --no-p90  # Use absolute maximum values instead

# Testing and debugging scenarios
pccu monitor --no-cache --block-start 18  # Fresh scan + custom block timing
pccu monitor --block-start 14 --show-sessions  # Override block start time
pccu monitor --debug  # Enable debug output to see processing messages

# Production monitoring examples
pccu monitor --interval 10 --token-limit 500000  # Conservative monitoring
pccu monitor --show-sessions --config team-config.yaml  # Team dashboard
pccu monitor --compact --interval 3  # Minimal display with frequent updates

# Cost tracking and pricing
pccu monitor --show-pricing  # Enable cost calculations and display
pccu monitor --show-sessions --show-pricing  # Session view with cost breakdown
pccu monitor --show-pricing --config pricing-config.yaml  # Cost monitoring with config

# Theme customization
pccu monitor --theme light  # Use light theme for this session
pccu monitor --theme dark --show-sessions  # Dark theme with session details
pccu monitor --theme ansi --show-sessions  # ANSI theme (respects terminal palette like Catppuccin)
pccu monitor --theme accessibility --show-pricing  # High contrast theme with pricing
pccu monitor --theme minimal --compact  # Minimal theme with compact display

# Model multiplier overrides
pccu monitor --model-multipliers opus=5.0,sonnet=1.0,default=1.0  # Override model multipliers
pccu monitor --model-multipliers opus=10.0,default=2.0  # Custom Opus multiplier with default fallback
--show-pricing is enabled)Generate usage reports:
# List all usage data (table format)
pccu list

# Output as JSON
pccu list --format json

# Output as CSV
pccu list --format csv

# Sort by different fields
pccu list --sort-by tokens
pccu list --sort-by session
pccu list --sort-by project
pccu list --sort-by time
pccu list --sort-by model

# Include cost information in output (table format)
pccu list --show-pricing

# Export usage data with costs as JSON
pccu list --show-pricing --format json

# Export usage data with costs as CSV
pccu list --show-pricing --format csv --output usage-with-costs.csv

# Combine sorting and pricing
pccu list --sort-by tokens --show-pricing --format table

# Save detailed report with costs to file
pccu list --show-pricing --output usage-report.json --format json

# Theme customization for list output
pccu list --theme light --show-pricing  # Light theme with pricing
pccu list --theme accessibility --format table  # High contrast theme
pccu list --theme minimal --sort-by tokens  # Minimal theme with token sorting
Generate comprehensive usage summaries with statistical analysis:
# Monthly summary (default) with totals, averages, and P90 statistics
pccu usage-summary

# Weekly breakdown for the last 8 weeks
pccu usage-summary --time-bucket weekly --period-limit 8

# Daily analysis for the last 30 days
pccu usage-summary --time-bucket daily --period-limit 30

# All-time summary across entire usage history
pccu usage-summary --time-bucket all

# Export comprehensive monthly analysis to CSV
pccu usage-summary --format csv --output monthly-summary.csv

# Detailed summary with model and tool breakdowns
pccu usage-summary --show-models --show-tools

# Summary with all statistics (including P90) and model breakdown
pccu usage-summary --show-p90 --show-models --show-pricing

# Minimal summary without P90 statistics
pccu usage-summary --no-p90

# JSON export for data analysis
pccu usage-summary --format json --output usage-analysis.json

# Theme customization for summary output
pccu usage-summary --theme dark --show-models
What the Summary Shows:
--show-models)--show-tools)Understanding P90 vs Average: P90 values are typically higher than averages because they represent the 90th percentile - meaning 90% of your sessions used less than this amount, while 10% used more. This helps identify your typical "high usage" sessions while filtering out extreme outliers. The gap between average and P90 indicates usage variability.
# Initialize configuration file
pccu init

# Set different types of limits
pccu set-limit token 500000      # Set token limit
pccu set-limit message 100       # Set message limit
pccu set-limit cost 25.50        # Set cost limit in USD

# Update maximums based on current usage and enable read-only mode
pccu update-maximums

# Preview configuration changes without applying them
pccu update-maximums --dry-run

# Force update even if config is read-only
pccu update-maximums --force

# Use only current active block totals instead of historical maximums
pccu update-maximums --use-current-block

# Use custom config file
pccu init --config my-config.yaml
pccu update-maximums --config my-config.yaml
# Clear file monitoring cache
pccu clear-cache

# Clear cache with custom config
pccu clear-cache --config my-config.yaml
# List all available themes
pccu theme list

# Set default theme (saves to config)
pccu theme set light

# Set theme with custom config file
pccu theme set dark --config my-config.yaml

# Check current theme
pccu theme current

# Use temporary theme overrides (doesn't save to config)
pccu monitor --theme light  # Light theme for this session only
pccu list --theme accessibility  # High contrast theme for this command
pccu list-sessions --theme minimal  # Minimal theme for session list
# Test webhook configuration (Discord and/or Slack)
pccu test-webhook

# Test with custom config file
pccu test-webhook --config my-config.yaml
The jsonl_analyzer.py tool helps analyze Claude Code's JSONL data files, which can be quite large with complex nested structures. This tool is essential for understanding the data format when debugging token counting issues or exploring Claude's usage patterns.
This tool is integrated into the main pccu CLI but can also be run standalone:
# Via the main CLI (recommended)
pccu analyze ~/.claude/projects/-Users-username-project/session-id.jsonl

# Or run sta
Sign in to join the discussion.
No comments yet. Be the first to say what this is good for.
🪨 why use many token when few token do trick — Claude Code skill that cuts 65% of tokens by talking like caveman

The best-benchmarked open-source AI memory system. And it's free.

Orca is the ADE for working with a fleet of parallel agents. Run any coding agent with your own subscription. Available on desktop, mobile and remote runtime.
A cross-platform desktop All-in-One assistant for Claude Code, Codex, OpenCode, OpenClaw, Grok Build & Hermes Agent. Only official website: ccswitch.io

Never stop coding. Free MIT AI gateway: one endpoint, 352 providers (150+ free), 1200+ models Kimi, Claude, GPT, Gemini, GLM, DeepSeek, MiniMax. Works with Claude Code, Codex, Cursor, OpenCode, Cline & Copilot. Quota-aware auto-fallback, RTK+Caveman compression saves 15-95% tokens, MCP/A2A, Desktop/PWA. Built by 550+ contributors

Compress tool outputs, logs, files, and RAG chunks before they reach the LLM. 20% fewer tokens for coding agents, 60-95% fewer tokens for JSON, same answers. Library, proxy, MCP server.