Strategy Consulting Visualization Skill
Messy notes in. Board-ready slides out.
One skill for your AI agent: turn notes, metrics, and prose into consulting-grade visuals — as real SVG slides, as an animated HTML deck, or as a spec any designer or tool can execute.
Rendering existing JSON specs into SVG/HTML uses the Python 3 standard library only, with no API key or network access required. Generating slides from notes in the browser requires your own Anthropic API key. The sample trial needs no key. Automated PDF export has optional browser dependencies.




English | 日本語
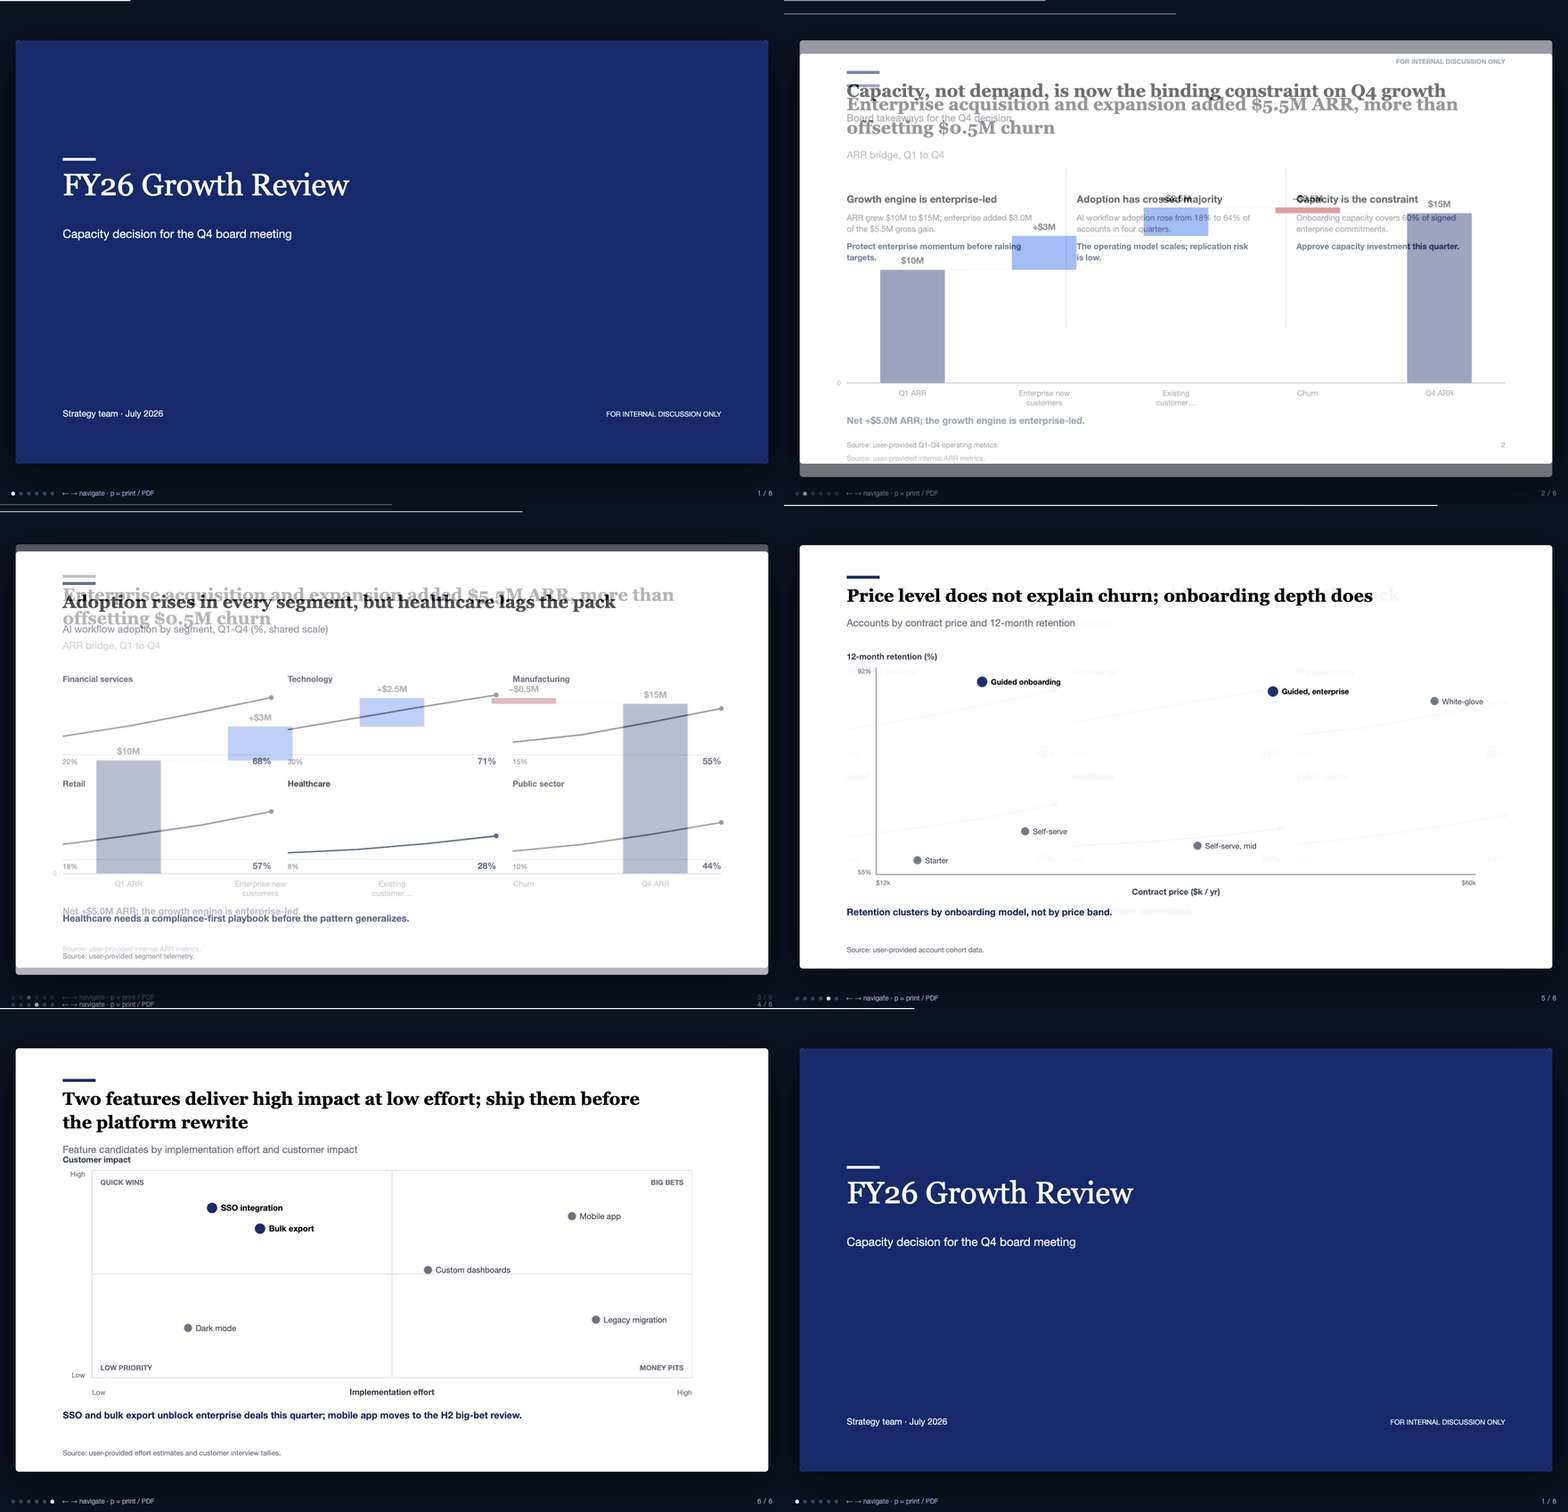
An actual deck built by this repo: specs (JSON) → SVG slides → animated HTML deck. Nothing hand-drawn.
Reproduce it: python3 scripts/scaffold_deck.py board-update -o demo && python3 scripts/build_html_deck.py --manifest demo/deck.json -o demo/deck.html
What’s new — September 9, 2026
Try a presentation on your phone before setting up an API key. Open the browser trial, choose Explore a sample deck, then Start presentation.
- Present directly in the browser. Swipe or use Previous / Next to move through slides; rotate your phone for a larger landscape view. Desktop keyboard navigation is also supported.
- Share or save HTML. Use the device share sheet where supported, with a download fallback. Present from the browser; reopening interactive HTML from iOS Files is not yet verified.
- Save a PDF. Choose PDF / Print, select landscape in the native print dialog, then use its share/save options. iOS may initially select A4 portrait.
- See the outcome before trying it. The homepage pairs a clearly labeled AI-generated hero concept with actual renderer output and a path from examples to the trial or installation.
- iOS fixes verified in Simulator. Japanese text and controls use an explicit Hiragino fallback; HTML sharing no longer creates an extra text file.
Tested with iPhone 17 / iOS 26.3 Simulator Safari: sample loading, presentation, swipe navigation, rotation, nine-page print preview, and PDF/HTML saving to Files. Existing 335 tests pass. Physical iPhone hardware, live API generation and AirPlay/projector output remain unverified. See the test record.
What’s new — September 8, 2026
- Refined business slides and diagrams. Updated the executive summary, growth waterfall, priority matrix, process flow and roadmap layouts, with clearer hierarchy, labels and decision cues. Regenerated the English and Japanese landing decks and site previews from the current renderer.
- Real deliverables on the site. The homepage now shows actual slide previews alongside a complete A4 brief, with links to the finished PDFs. Examples use illustrative business data.
- HTML first, PDF for sharing. Keep chart data in JSON and report prose in Markdown, refine the generated HTML, then export it directly to PDF. Decks and reports include a Save as PDF button;
scripts/export_pdf.py also supports command-line export.
- Reference-based layouts. A design study of nine public documents from six consulting firms informs the analytical slide and compact report templates.
Explore the updated nine-slide board deck (PDF), one-page decision brief (PDF), and source HTML. See HTML to PDF for export commands. Automated PDF export requires Python Playwright and installed Chrome or Chromium; core SVG/HTML generation has no third-party Python dependencies.
Why This Gets Starred
- Install it and get a complete deck immediately.
scripts/scaffold_deck.py <archetype> copies a full, coherent 9-12 slide deck — cover through closing — into a working directory. Swap the illustrative data for yours and build. Six archetypes ship, one in Japanese.
- It actually renders. 22 patterns produce real SVG slides — waterfall, executive summary, 2×2, scatter, heatmap, Gantt, small multiples, cover, section dividers, agendas, closings, and more. Every gallery image below is committed renderer output, verified fresh by CI on every push.
- Animated HTML decks from one command. Combine slides into a single self-contained HTML file: quiet staggered reveals, keyboard navigation, progress bar, zero external requests. Press
p → your browser prints it → you have a PDF.
- A browser-native report mode.
scripts/build_html_report.py turns Markdown into a self-contained, print-to-A4 HTML document with numbered exhibits — the same visual system, for documents instead of decks.
- Works with your slide tools. The SVGs drop straight into PowerPoint, Keynote, and Word (Insert → Picture). For Google Slides, export PNG from any browser first.
- Japanese business documents are first-class. CJK text wraps correctly (measured per fullwidth character, not by spaces), fonts fall back to Noto Sans JP / Hiragino, and there are dedicated profiles for 稟議書, 役員会資料, 週報, 学会抄録.
- Charts that survive an audit. Bar proportions match the data (Lie Factor ≈ 1.0), zero baselines are marked, cell text passes WCAG AA contrast across the whole color ramp, and the accent navy stays readable in greyscale print — all of it asserted in the test suite, not promised in prose.
- Roasted by five design legends, then fixed. We ran the whole system through a five-perspective design panel — Tufte's data-ink discipline, an ex-McKinsey chart master, Swiss grid typography, FT-style data journalism, and modern design engineering. They scored it 5.8/10 and listed every flaw. A previous release shipped every fix. Read the receipts.
60-Second Start
# 1. Install it as an agent skill (Claude Code, Cursor, Codex, and 70+ agents)
npx skills add kgraph57/mckinsey-style-visualization-skill
Or clone it directly (also gets you the runnable scripts below):
# 1. Get it (Claude Code clone install)
git clone https://github.com/kgraph57/mckinsey-style-visualization-skill.git ~/.claude/skills/strategy-consulting-visualization
cd ~/.claude/skills/strategy-consulting-visualization
# 2. Render one slide → SVG
python3 scripts/render_slide_spec.py examples/render-specs/arr-waterfall.json -o slide.svg
# 3. Build the full animated deck → one HTML file
python3 scripts/build_html_deck.py --manifest examples/demo-deck.json -o deck.html
open deck.html # ← arrows to navigate, "p" to print → PDF
Or skip the terminal and just ask your agent:
Use the strategy consulting visualization skill to turn these notes into a board slide:
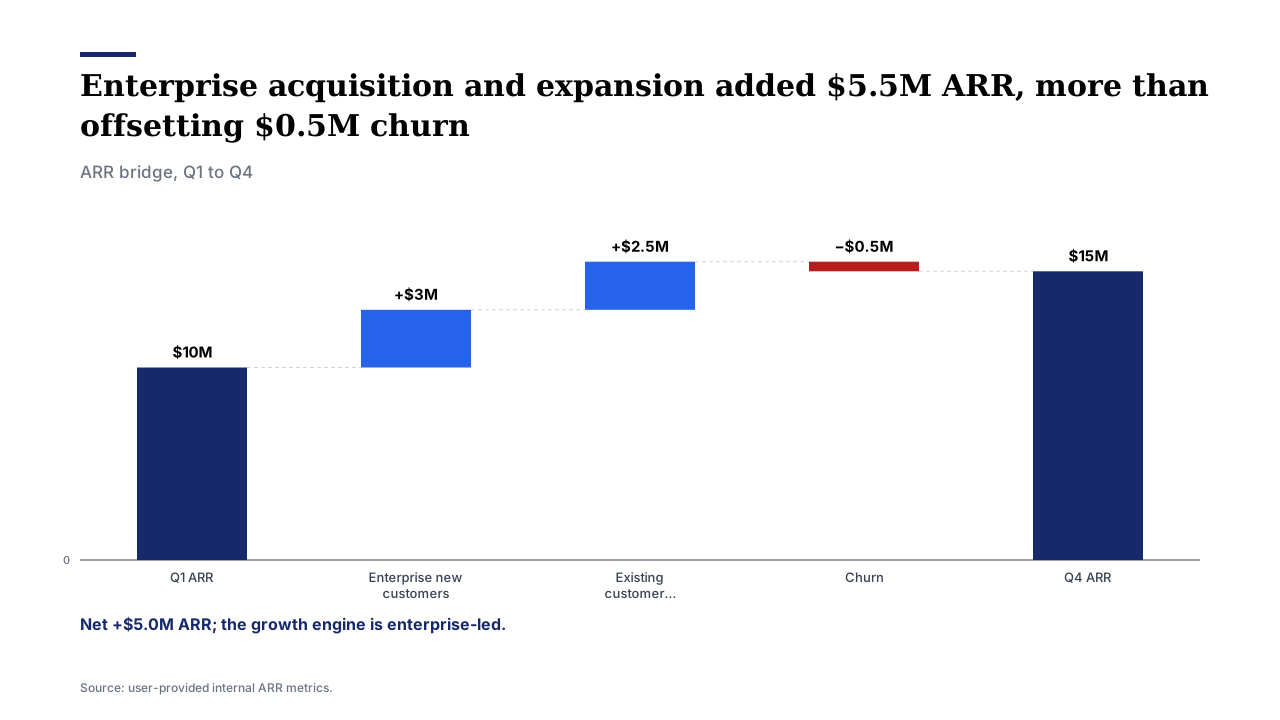
ARR grew from $10M to $15M. Enterprise added $3M, expansion $2.5M, churn -$0.5M.
The board must decide on implementation capacity investment.
The Pipeline
flowchart LR
A["Messy notes,<br/>metrics, prose"] --> B["Slide spec<br/>(JSON)"]
B --> C["SVG slides"]
C --> D["Animated HTML deck"]
C --> E["PowerPoint / Keynote / Word<br/>(insert SVG)"]
D --> F["PDF<br/>(browser print)"]
Specs are plain JSON, so they diff, review, and version like code. The renderer and deck builder are single-file Python scripts with no installs.
Gallery
Every image is committed output of scripts/render_slide_spec.py — CI fails if any of them drifts from what the renderer actually produces. Specs live in examples/render-specs/.
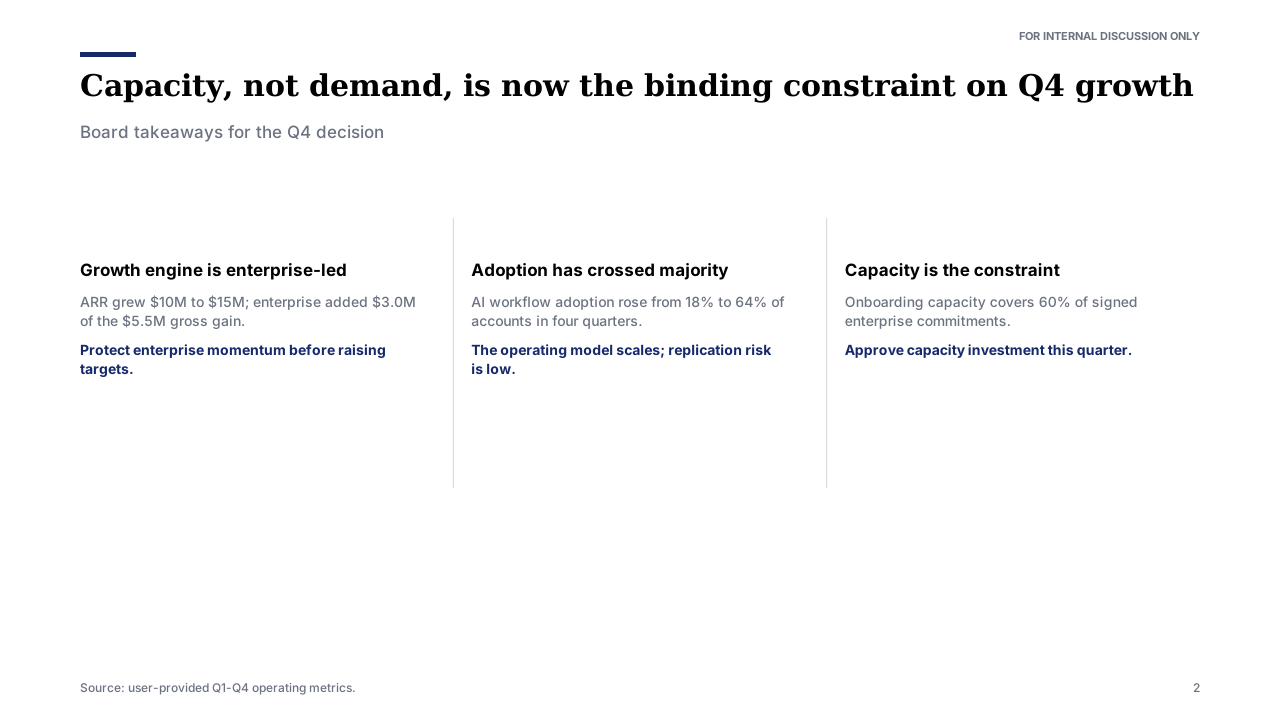
| ARR Waterfall | Executive Summary Strip |
|---|
 |  |
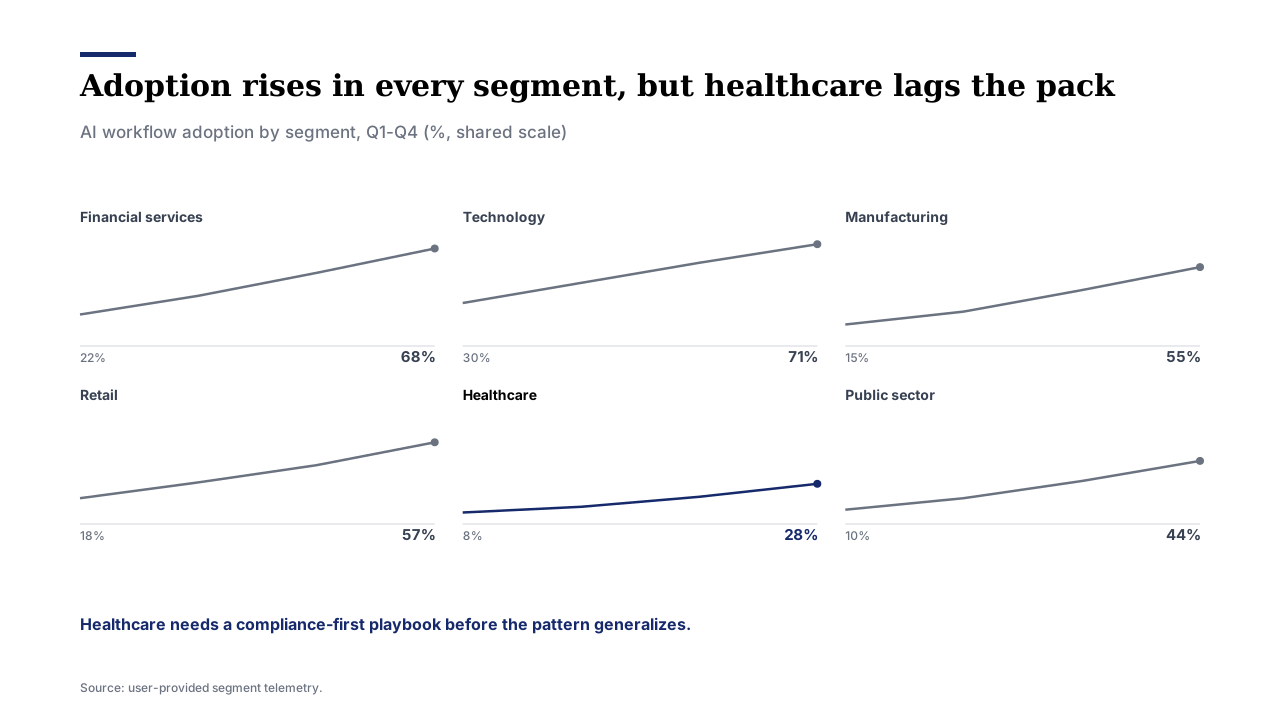
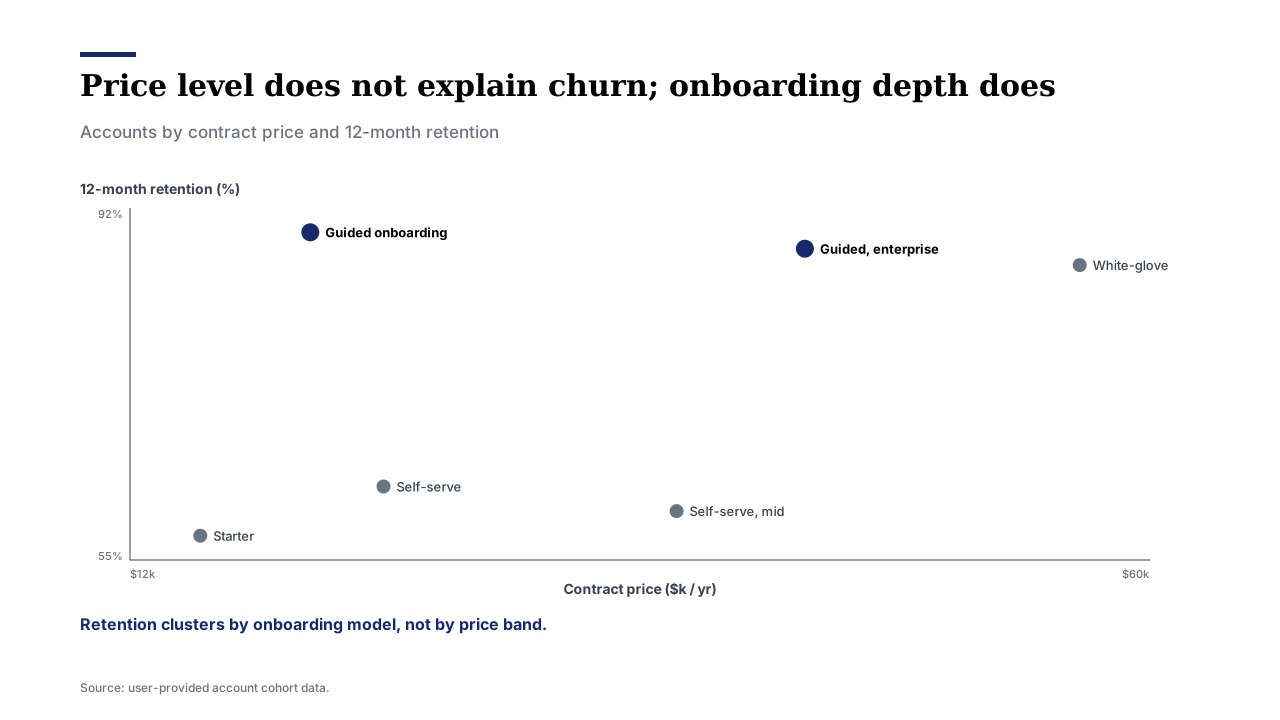
| Small Multiples | Scatter / Correlation |
|---|
 |  |
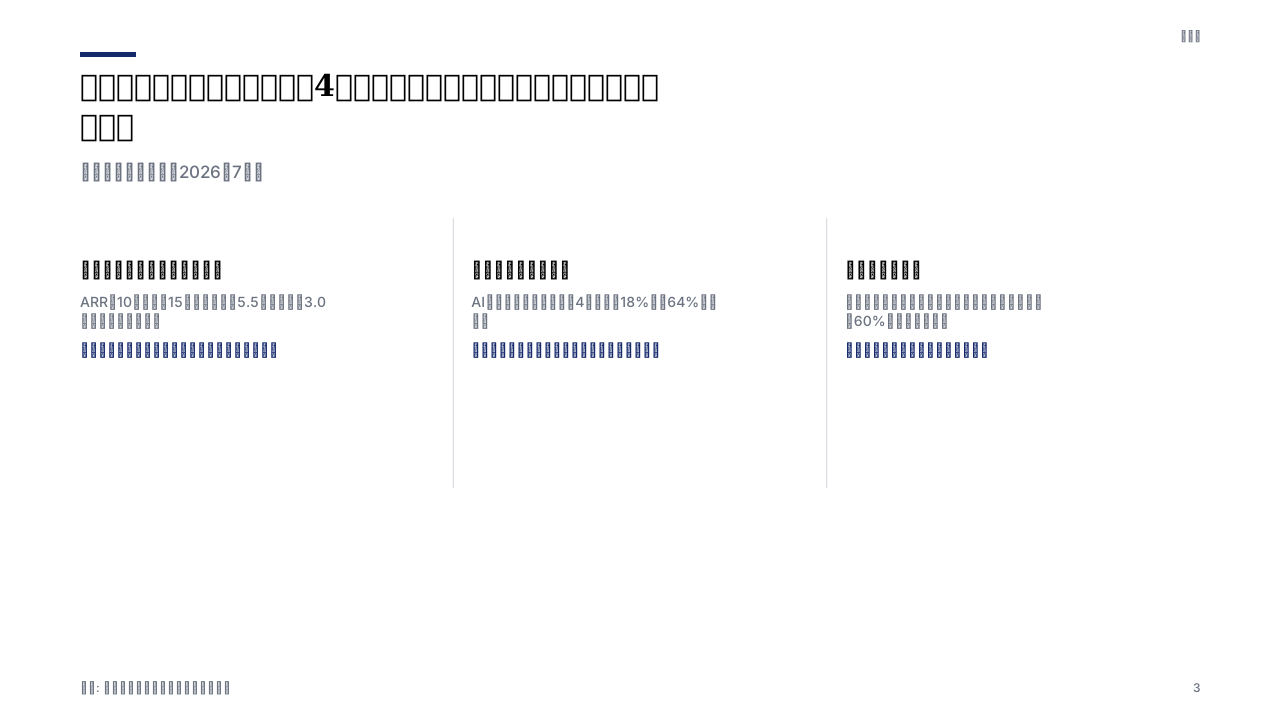
| Japanese Board Summary(役員会サマリー) | Cover Slide |
|---|
 |  |
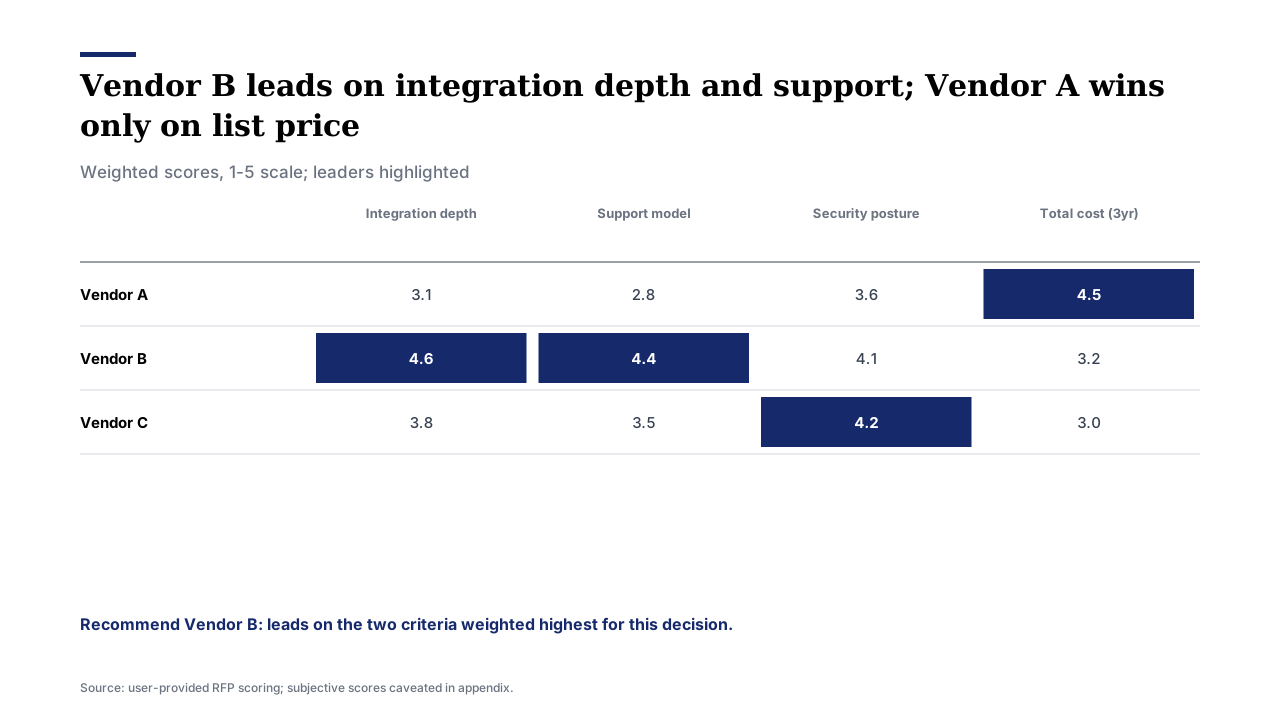
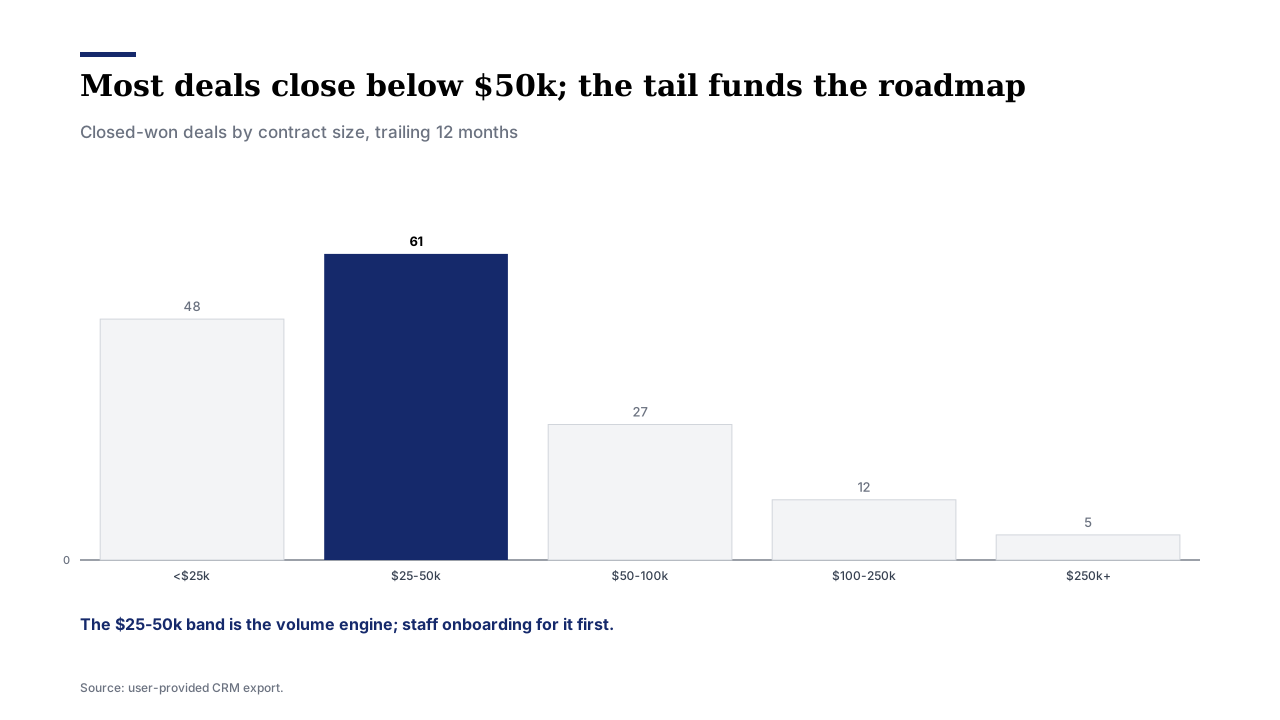
| Benchmark Table | Distribution |
|---|
 |  |
| Capacity Gap | Process Flow |
|---|
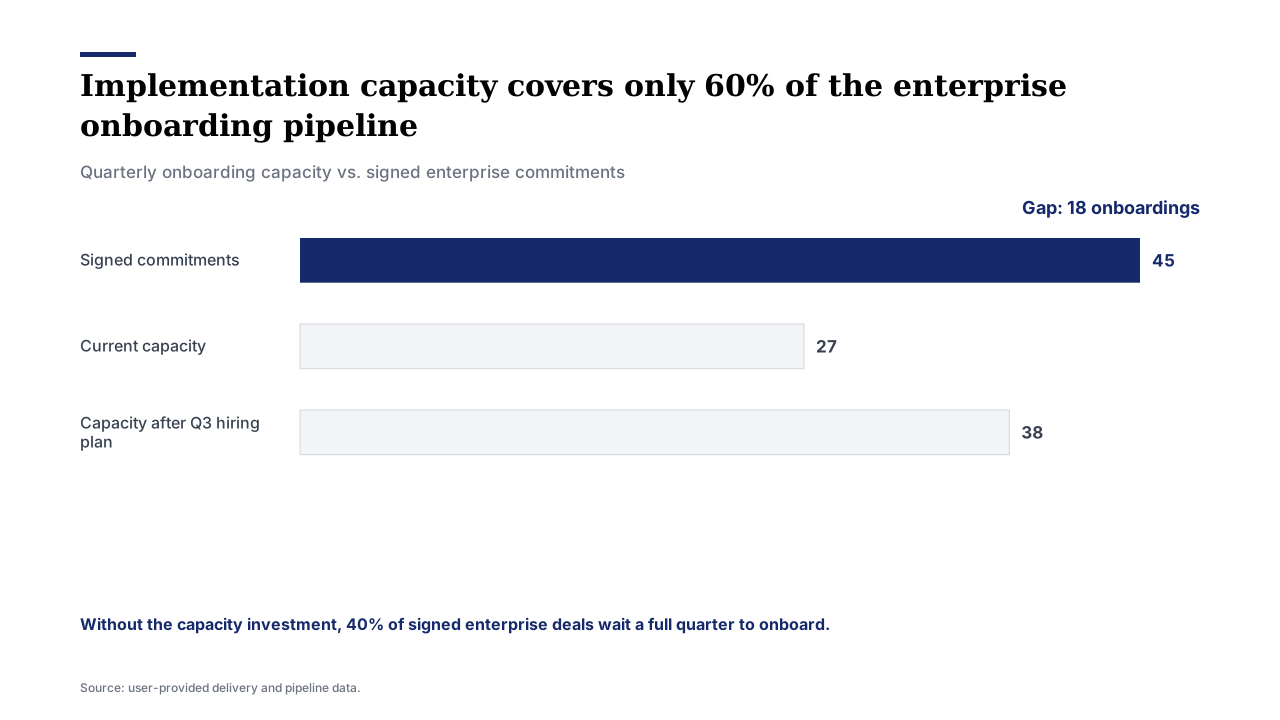 | 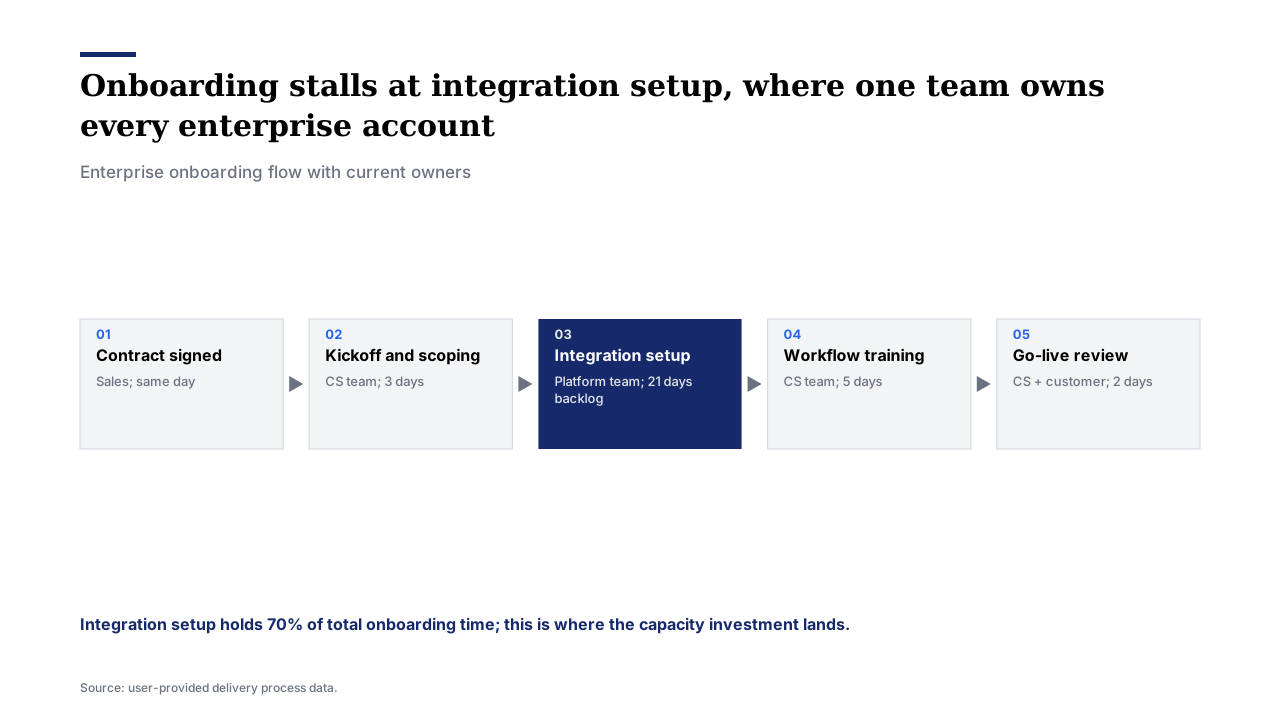 |
22 patterns render to SVG: cover, section_divider, end_cover, agenda, bullet_list, closing, quote, waterfall, gap, before_after, time_series, benchmark_table, summary_strip, process_flow, funnel, heatmap, gantt, kpi_scorecard, two_by_two, scatter, distribution, small_multiples. Thirteen more patterns (Sankey, pyramid, maps, decision trees, …) ship as structured specs and image-generation prompts — the catalog says exactly which is which. We don't pretend.
Animated HTML Decks
python3 scripts/build_html_deck.py cover.json bridge.json summary.json -o deck.html --title "Q4 Review"
One command, one file, and you get:
- Quiet, staggered element reveals on every slide — the restrained kind, not slide-carnival transitions (
prefers-reduced-motion respected)
- Keyboard + click navigation, progress bar, slide counter, deep links (
deck.html#3)
- Print stylesheet:
p or Cmd+P gives you one slide per page → save as PDF
- Zero external requests — fonts, styles, scripts, and SVGs are all inline. Email it, host it, present offline.
Try the committed demo: examples/demo-deck.html (open locally after cloning).
Instant Deck: Scaffold → Build
Skip writing specs from a blank page. Pick an archetype, copy it, swap in real data:
python3 scripts/scaffold_deck.py --list # see all 6 archetypes + slide counts
python3 scripts/scaffold_deck.py board-update -o my-deck --title "FY27 Board Update"
# edit my-deck/specs/*.json with real numbers — the pattern shapes are already right
python3 scripts/build_html_deck.py --manifest my-deck/deck.json -o my-deck/deck.html
scaffold_deck.py refuses to overwrite a non-empty directory unless you pass --force, and prints the next two commands when it's done.
Template Gallery
Six deck archetypes ship pre-filled with a coherent illustrative storyline — every slide renders, nothing is a stub.
| Archetype | Use For | Storyline |
|---|
board-update | Recurring board / steering updates | Cover → agenda → executive summary → KPI scorecard → ARR waterfall → trend → risk view → closing → end cover |
strategy-recommendation | "Where to play, how to win" strategy decks | Cover → agenda → context → two section dividers (Where to play / How to win) → 2×2 → benchmark table → gap or bridge → roadmap → closing → end cover |
project-status | PMO / steering-committee status reviews | Cover → summary → roadmap → KPI scorecard → blockers → path-to-green flow → closing → end cover |
market-entry | Entry or expansion investment cases | Cover → agenda → market trend → competitor benchmark → segment 2×2 → entry-path flow → distribution or scatter → closing → end cover |
sales-proposal | Customer-facing proposals | Cover → client situation → before/after → approach flow → plan → why-us benchmark → customer quote → closing → end cover |
board-update-ja | 役員会向け月次アップデート(日本語) | board-update と同じ構成を、翻訳調ではなく自然な日本語の見出しで |
Report Mode: Markdown → Browser Document
For a document instead of a deck, write Markdown and build it straight to a single self-contained, print-to-A4 HTML report:
python3 scripts/build_html_report.py my-report.md -o my-report.html --lang en
- Front matter (
title, subtitle, author, date, classification, lang) drives a navy title band — the only navy surface in the document.
##/### headings auto-number and build a "Contents" TOC with anchor links; standard Markdown (bullets, ordered lists, tables, bold/italic, code, blockquotes, links) renders as clean editorial typography — everything HTML-escaped first, so nothing in the source can inject markup.- Drop in a rendered chart with
 — it becomes an auto-numbered Exhibit N — Caption with the full slide SVG embedded inline, no header/footer chrome needed.  embeds an existing SVG file the same way.
p / Cmd+P exports an A4-portrait PDF with the title band as the first page.- Zero external requests — same self-contained guarantee as the HTML deck.
Three starting points ship in templates/reports/: board-pre-read.md, one-pager.md, proposal-memo.md. See the committed demo: examples/demo-report.html (built from examples/demo-report.md).
Speaker Script: What You Read at the Podium
Any slide spec can carry a top-level "notes" field — a string, or a list of paragraph strings — holding the spoken narration for that slide. The SVG renderer ignores it completely, so adding notes never changes a rendered slide. Build the same deck manifest into a print-first, one-slide-per-page script:
python3 scripts/build_speaker_script.py --manifest my-deck/deck.json -o my-deck/script.html --lang en
- One printed A4 page per slide: the slide rendered inline above, the narration in podium-readable type below (screen 20px, print ~13.5pt;
--lang ja loosens line-height to 1.9 with palt for CJK).
- A slide with no notes still gets its own page, with a muted "(no script)" / "(原稿なし)" marker — never silently skipped.
- A cover page carries the deck title and the date from the deck's own cover slide, if present.
- Zero external requests, no required JavaScript.
See the committed demo: examples/demo-script.html (built with --lang ja from templates/decks/board-update-ja/deck.json).
Deck as an Article: Read It Top to Bottom Like a Web Page
The same notes field also drives a reading-mode build: the whole deck laid out vertically on a single 680px column, each slide's SVG followed by its narration as prose — a paper-first article, like a published M3-series piece, not a side-nav document.
python3 scripts/build_html_article.py --manifest my-deck/deck.json -o my-deck/article.html --lang en
- A hero opens the page: an optional uppercase kicker from the manifest's
series key, the title, an optional lead paragraph from lead (falling back to description for older manifests), and meta chips for slide count, presenter, and date (from the deck's cover slide).
- Every slide appears, in manifest order, as its own
<article> on the full 680px column — meta line (number + optional per-spec label), heading, SVG, then its notes as prose. There is no "Contents" jump list in this mode; it is a single linear scroll.
- A slide with no notes renders frame-only — the article still shows every slide, like flipping through the deck.
- Optional per-slide
refs ([{"label": ..., "url": ...}]) render as a "Links" aside below the notes and roll up, deduped by URL, into an "All links" section after the last slide; only http(s)/mailto URLs render as links.
--title overrides the manifest title; zero external requests except the href of a ref link itself.
See the committed demo: examples/demo-article.html (built from templates/decks/board-update/deck.json).
Export Anywhere
| Target | How | Fidelity |
|---|
| PDF | Open the HTML deck → print → save as PDF | Vector, one slide per page |
| PowerPoint / Keynote / Word | Insert the SVG files as pictures | Vector, scales losslessly |
| Google Slides / Docs | Render SVG → PNG in any browser, then insert | Raster at any resolution |
| Design tools (Figma, Illustrator) | Open the SVG directly | Fully editable vectors |
| Docs / wikis / GitHub | Embed the SVG — GitHub renders it inline | What you see in this README |
Roasted by Five Design Legends
Most chart generators say "beautiful". We wanted defensible, so we convened a five-perspective design review panel (as rigorous AI personas) and told them to be merciless:
| Reviewer lens | Verdict | Sharpest cut |
|---|
| Edward Tufte — data-ink, honest scales | 5.5/10 | "Meaningless decorated rectangles baked into the renderer" |
| Gene Zelazny — ex-McKinsey, Say It With Charts | 6.5/10 | "The flagship example violates its own headline rule" |
| Vignelli × Müller-Brockmann — Swiss grid | 6/10 | "A corporate template, not a design system" |
| Alan Smith — FT data journalism | 5.5/10 | "The waterfall draws off-canvas on negative bridges" (he proved it) |
| Modern design engineering | 5.5/10 | "2016 visuals wearing a 2020s spec sheet" |
Then we shipped every fix in a prior release: zero-floor waterfalls, CJK-correct wrapping, no silent truncation, a single re-derived navy that survives greyscale printing, diverging heatmaps for signed data, WCAG-AA cell text asserted across the entire ramp, decoration stripped, a comparison-type gate before every chart choice, and a rubric that now measures data-ink integrity and deck-level storyline logic.
The result is a visual system you can defend in front of a board, an auditor, or a design critic — because it already survived one.
The Discipline Under the Hood
The renderer is the visible part. The skill underneath is a full operating system for executive visualization:
- Message first: every visual starts from the reader's decision, gets a single-proposition insight headline, and only then picks a chart — gated by the five comparison types (component / item / time series / distribution / correlation).
- A real style system: design tokens on an 8px grid, a fixed type scale, one navy, an emphasis ladder (fill > line > text) with hard caps — the same constants the renderer executes.
- A quality rubric with teeth: 24-point scoring across strategy, data integrity, data-ink honesty, hierarchy, portability, and safety, plus blocking gates (no color-only meaning, no invented data, no implied rendering that doesn't exist).
- An adversarial review loop: expert lenses that hunt overclaims, insider jargon, accessibility failures, and cultural assumptions before anything is called publishable.
By Role
The persona playbook gives every role a copy-paste prompt and a rendered example:
| Role | Ask For | Rendered Example |
|---|
| Sales | Pipeline QBR, proposal visuals | 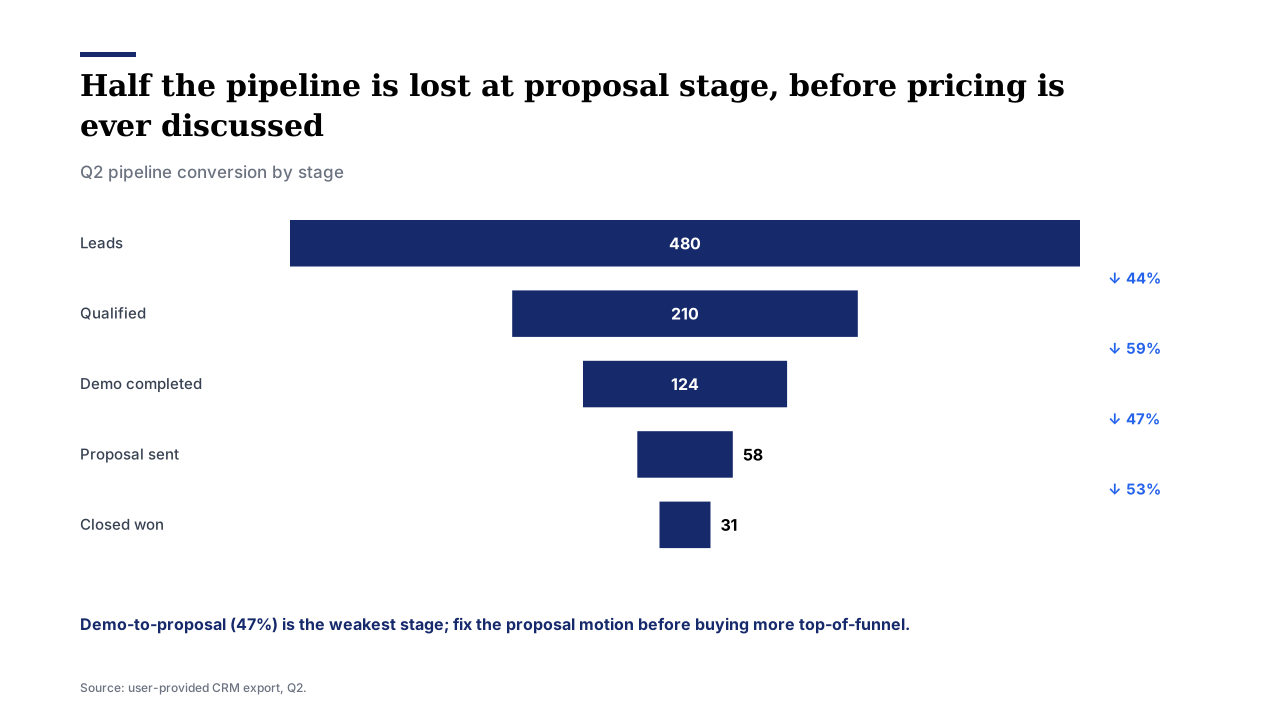 |
| Project manager / PMO | Roadmap with critical path | 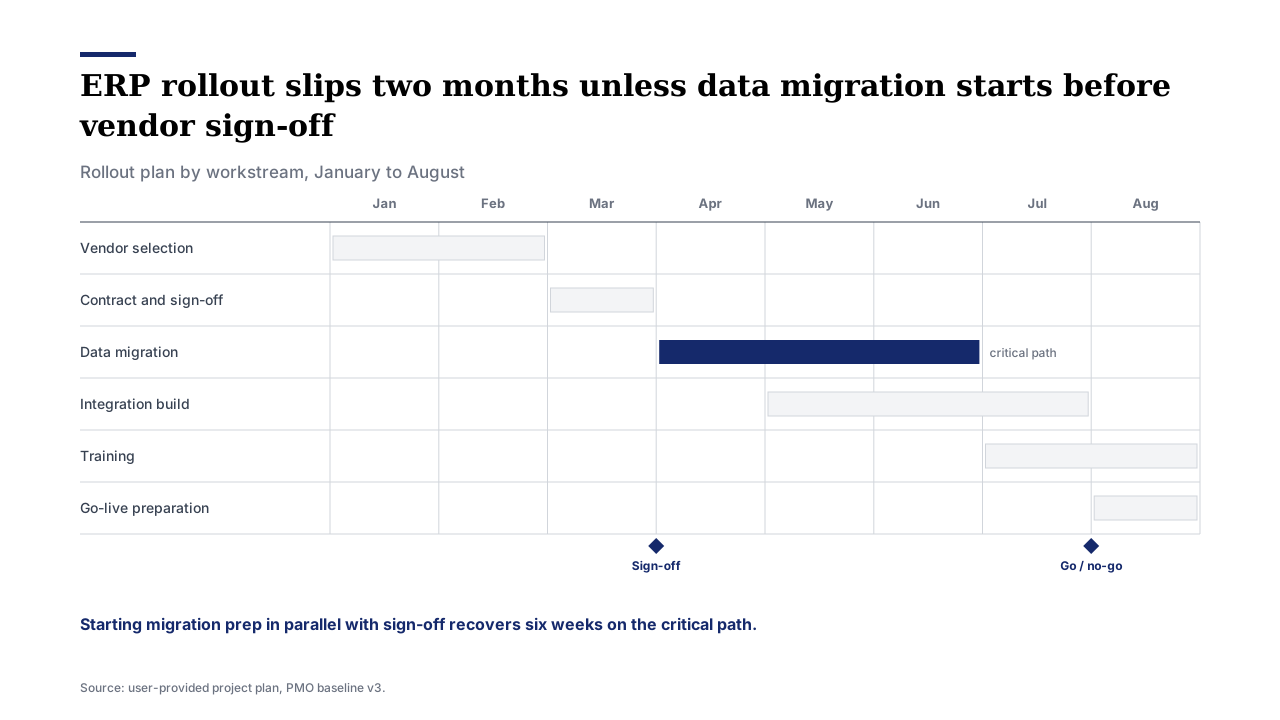 |
| Marketing | Channel × segment performance | 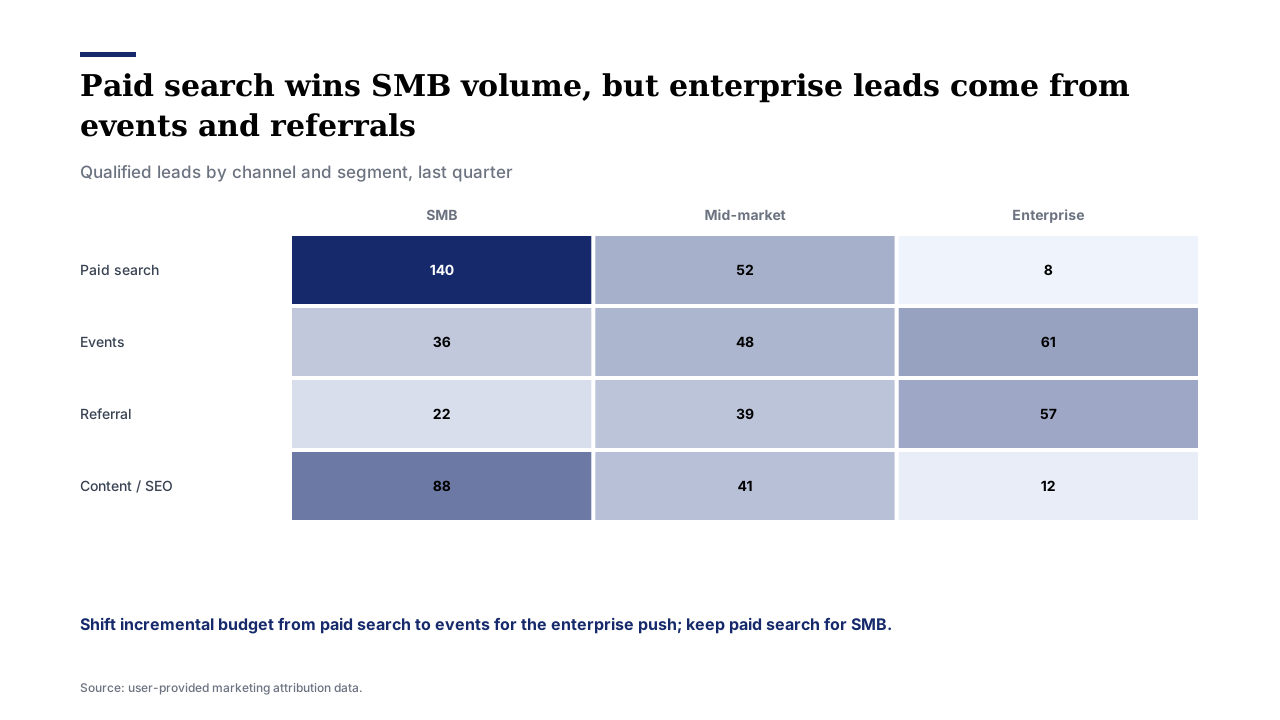 |
| HR / People ops | Talent scorecard | 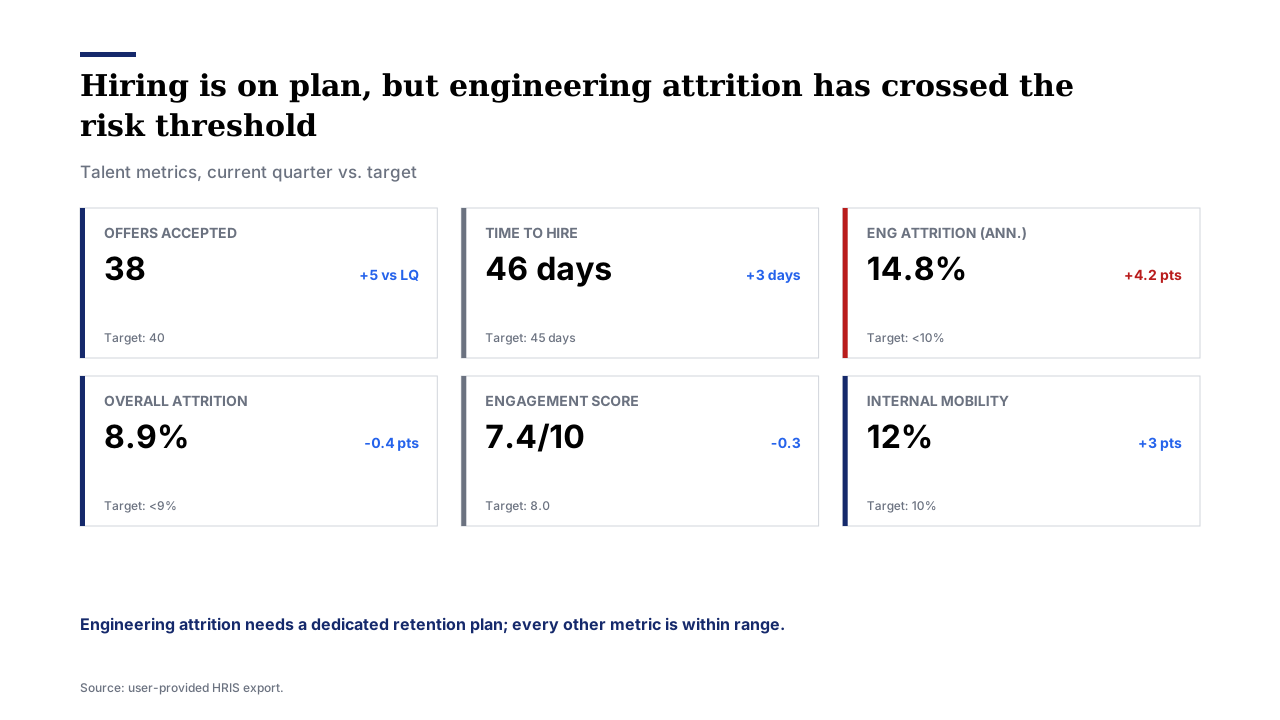 |
| Product manager | Effort vs. impact prioritization | 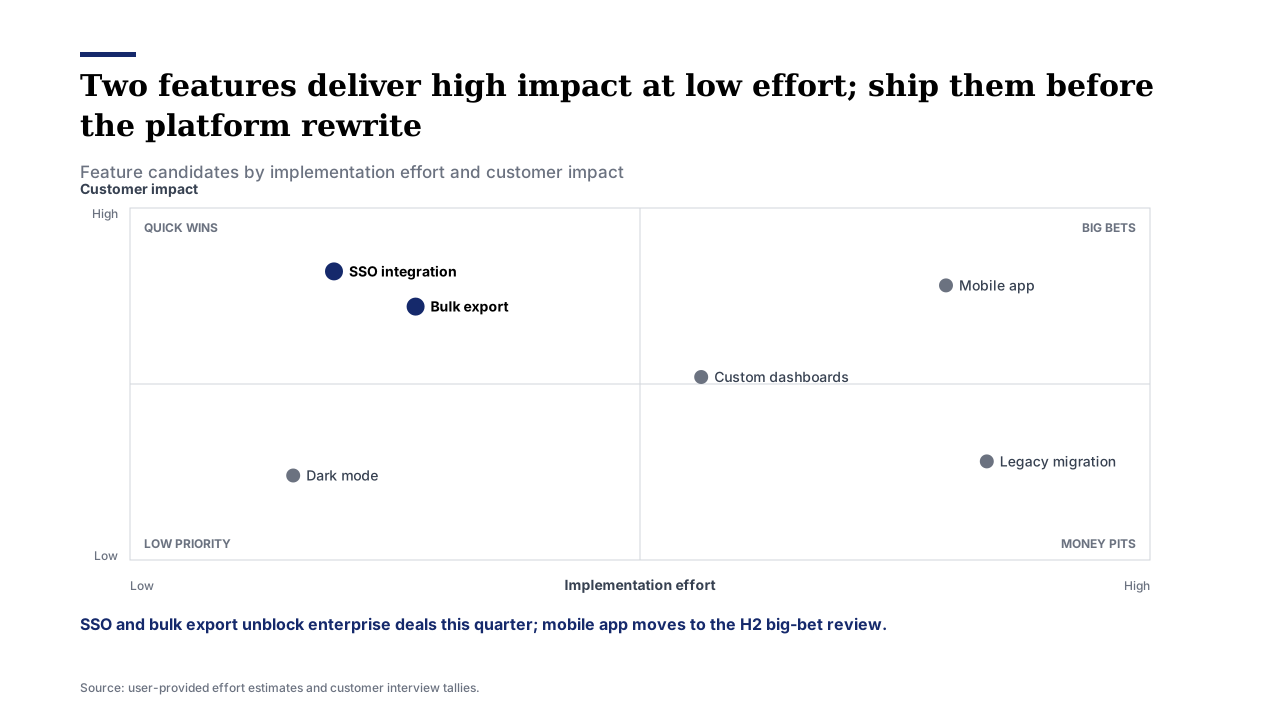 |
| Engineer / Tech lead | Incident postmortem flow | 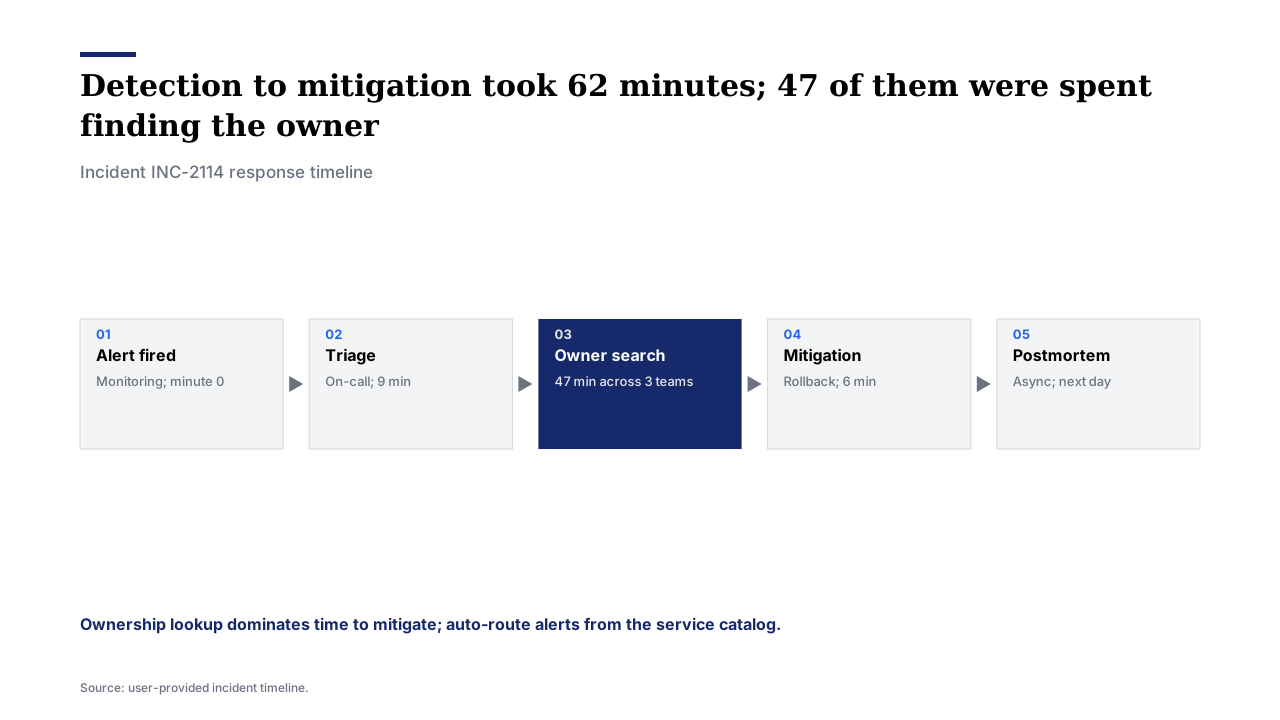 |
| Researcher / Clinician | Study outcome summary | 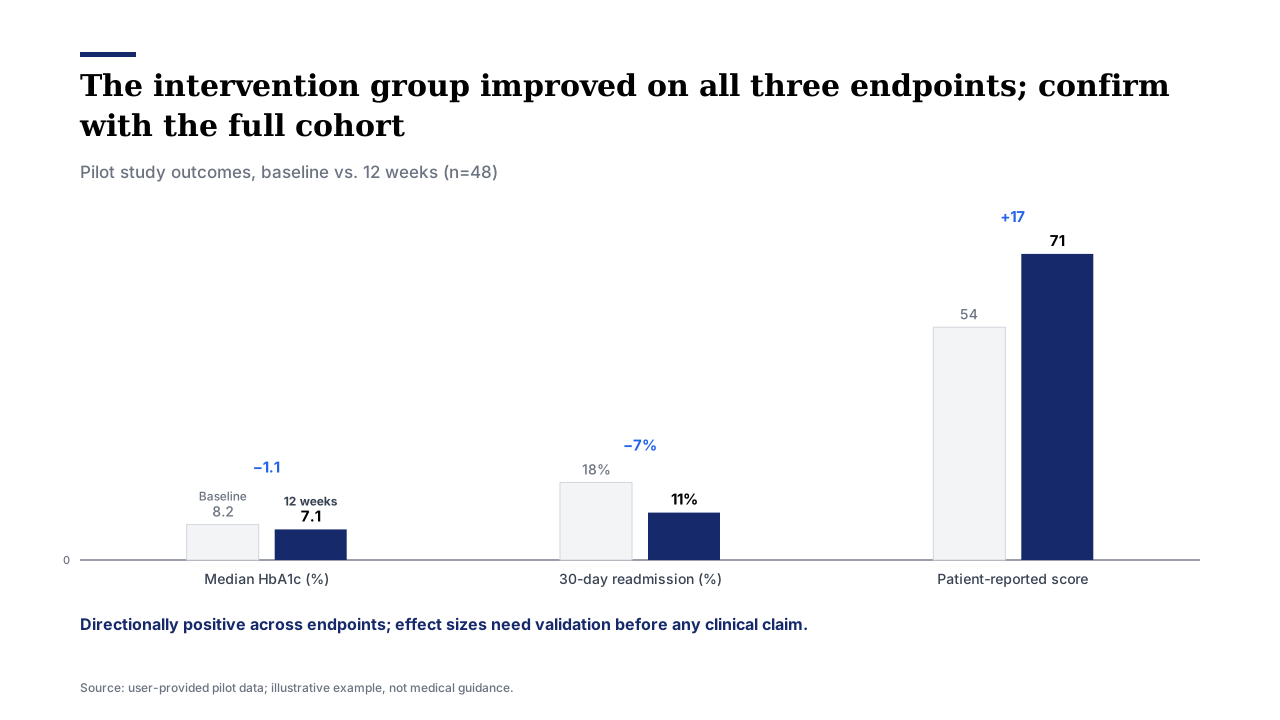 |
Japanese business formats (稟議書, 週報・月報, 役員会資料, 学会抄録, 提案書) have dedicated profiles in document-type-profiles.md.
One-Minute Example
Give the skill this:
ARR grew from $10M to $15M.
Enterprise expansion contributed $3M. Existing customers added $2.5M. Churn cost $0.5M.
AI workflow adoption grew from 18% to 64%.
The board needs to decide whether to invest in implementation capacity.
It returns a decision-framed spec — strategic question, single-proposition headline, pattern choice with reasoning, exact values and labels, assumptions, and a rubric score — that renders to the waterfall you saw in the gallery. See the full worked proof: input → slide specs → evaluation.
Case Study: the full loop in two minutes
SaaS Board Update — Raw Notes to a Board-Ready Slide walks one real pass end to end: anonymized founder notes → weak first draft → the packaged reviewer rejects it (14/20) → decision-first revision passes (20/20) → the committed rendered slides. Every artifact is in this repo and reproducible with two commands.
What You Can Point It At
| Starting Point | You Get |
|---|
| Board update metrics | 5-slide story: cover, waterfall, trend, gap, recommendation |
| Revenue bridge data | Waterfall with drivers, honest baselines, assumptions |
| Competitor / vendor data | Benchmark table + 2×2 positioning with leader highlights |
| KPI before/after data | Impact slide with deltas and an implication headline |
| Process description / SOP | Process flow with owners and the bottleneck highlighted |
| Segment metrics over time | Small-multiples grid on one honest shared scale |
| Research notes / whitepaper | Numbered report figures with sources and distributions |
| Any prose — "visualize this" | Input triage → right pattern → document profile → spec |
Install
# Skills CLI (skills.sh) — works with Claude Code, Cursor, Codex, and 70+ agents
npx skills add kgraph57/mckinsey-style-visualization-skill
Alternative — Claude Code clone install:
# Personal skill (Claude Code)
git clone https://github.com/kgraph57/mckinsey-style-visualization-skill.git ~/.claude/skills/strategy-consulting-visualization

# Project skill
git clone https://github.com/kgraph57/mckinsey-style-visualization-skill.git .claude/skills/strategy-consulting-visualization
Verify the package (same checks CI runs):
python3 -m unittest discover -s tests
python3 scripts/validate_skill.py   # → OK: skill package passed validation
The validator re-renders every committed SVG and the demo deck from source specs and fails on any drift — the gallery cannot silently rot.
Star It, Break It, Share It
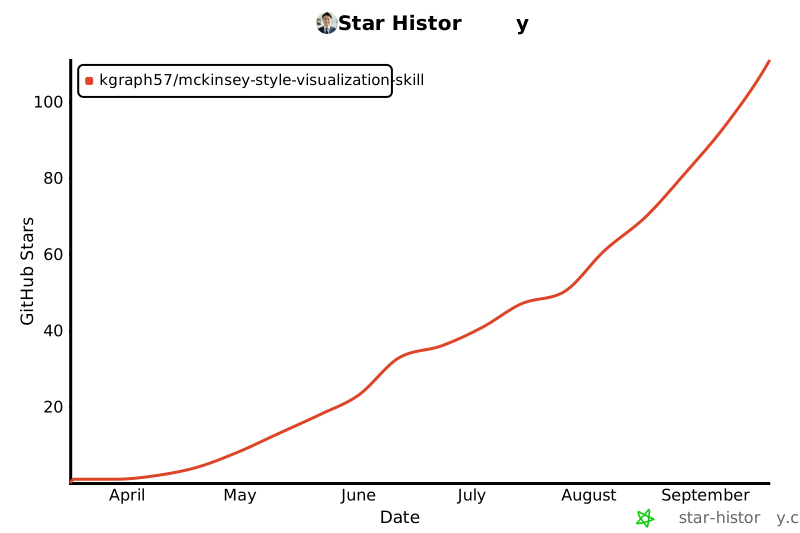
If this turned your rough notes into a usable slide, star the repo — stars are how other people find tools that actually render instead of hallucinate.
Even better contributions:
- A messy input and the slide it produced (Discussions)
- A business scenario that needs a pattern we don't have (request template)
- An output that's broken, confusing, or overconfident — it becomes a regression test
Repository map & package internals
Iterative review-loop examples (draft → review → revision, four scenarios) live in examples/review-loop/. Distribution and commercial docs: MARKETPLACE.md, BUYER_BRIEF.md, ROADMAP.md, SECURITY.md, CHANGELOG.md.
Disclaimer
This is an independent skill package. It is not affiliated with, endorsed by, or sponsored by McKinsey & Company, Boston Consulting Group, Bain & Company, or any other consulting firm. Named firms may appear only as common style references or search terms.
License
MIT. See LICENSE.
Reference-led slides and editable Word briefs
The six-firm design study records actual pages and exhibits, with an explicit evidence trail. Use the reproduction workflow to choose a reference and compare hierarchy, geometry, chart encoding and pagination.
Working templates include an analytical chart with a commentary rail, compact HTML report, and editable A4 Word brief. Word export is optional and requires Node.js packages docx and sharp; core SVG/HTML rendering remains Python-standard-library only. Chart figures in Word are SVGs with PNG fallbacks, while text and tables remain editable.
HTML to PDF
Use JSON for charts and Markdown for the narrative. Generate HTML, review it in the browser, and export that same HTML to PDF. HTML is the primary layout artifact; Word is an optional separate export. Reports use A4 print styles; decks use one 16:9 slide per page.
python3 -m pip install playwright
python3 scripts/build_html_report.py templates/reference-layouts/decision-brief.md -o brief.html
python3 scripts/export_pdf.py brief.html -o brief.pdf
python3 scripts/export_pdf.py examples/demo-deck.html -o deck.pdf
PDF export requires installed Google Chrome or Chromium (--browser /path/to/browser for a custom executable). SVG and HTML generation remain Python-standard-library only. Alternatively, open the generated HTML, choose Save as PDF, and select the browser’s PDF destination. Inspect every page after changing content; longer reports may need deliberate page breaks.