
JuliusBrussee/
caveman

🪨 why use many token when few token do trick — Claude Code skill that cuts 65% of tokens by talking like caveman
105k
1 add
OpenTab brings local usage history from coding agents into one place so you can browse sessions, turns, tools, and pricing. It works in the terminal or a browser, and it can also export a self-contained HTML report or serve a local MCP interface.
Builders who want to inspect where Claude Code, Codex, OpenCode, Copilot, and similar tools spent tokens, time, and money.
You can trace a cost spike back to the session, turn, tool call, or subagent that caused it.
Shows usage by day, week, month, project, provider, model, and machine, with drill-down into sessions and turns.
Breaks down context-window growth, tool usage, and subagent costs so you can see what drove a session.
Compares recorded usage and API-equivalent estimates against other model prices using the bundled catalog.
Runs locally in the terminal or at `opentab web`, and can export a static HTML report with `opentab --html report.html`.
Collects summaries from other machines over SSH with `opentab pull`, then browses them together.
Provides versioned JSON commands and a local stdio MCP server through `opentab usage summary --range 30d` and `opentab mcp`.
Keeps browsing local and read-only, and can anonymize history in memory with `opentab --demo`.
pipx install opentab-ai
opentab
brew install hamidi-dev/tap/opentab         # Homebrew (macOS / Linux)
pip install --user opentab-ai               # pip
curl -fsSL https://raw.githubusercontent.com/hamidi-dev/opentab/main/install.sh | bash
Your AI coding tools keep a tab. OpenTab opens it.
See where your coding agents spent their tokens, time, and money.
OpenTab brings the history your tools already keep into one interactive browser. Follow a busy month into a project, a session, its subagents, and individual turns. See what filled the context window. Compare the same token usage at another model's prices.
Works with Claude Code, Codex, OpenCode, Copilot, and more. Runs locally, in your terminal or web browser. No account, no telemetry, and your agents' history stays read-only.
Find the session behind the spike. Explore the calendar and drill from a month into the work behind it. Anonymized demo data; click for the full-quality video.
pipx install opentab-ai
opentab
OpenTab discovers supported tools' local records and brings them together automatically. Start with a recent day, open Sessions, and pick one you remember. Press Enter to drill in, Esc to step back, and ? for the keys that work where you are. The mouse works too.
On a subscription? You can still explore your usage: OpenTab starts with clearly labeled
API-equivalent estimates for tokens that have no recorded cost. $ switches to
recorded spend. How the money works.
Python 3.9+ · macOS · Linux · WSL · native Windows.
The PyPI package is opentab-ai; the command is opentab.
brew install hamidi-dev/tap/opentab         # Homebrew (macOS / Linux)
pip install --user opentab-ai               # pip
curl -fsSL https://raw.githubusercontent.com/hamidi-dev/opentab/main/install.sh | bash
Upgrade with pipx upgrade opentab-ai, brew upgrade opentab, or
pip install -U --user opentab-ai.
The runtime uses Python's standard library, with windows-curses added automatically
on native Windows. Windows & WSL setup.
Prefer a browser? Run opentab web. Showing someone your screen? opentab --demo
anonymizes your existing history in memory. If a tool is missing, opentab doctor
explains what was found and what needs attention.
Automating it? OpenTab also provides versioned JSON resource commands and a local
stdio MCP server: opentab usage summary --range 30d and opentab mcp. See
Programmatic access for commands, schemas, and privacy gates.
Pick a day on the spend heatmap. Open its sessions, sort by cost, and follow the largest one. The Subagents view shows how the work's cost splits between the main agent and its delegates, including nested subagents. You can see whether one delegate accounts for most of the total or the cost is spread across the team.
Then open Turns: prompts, the steps that followed, and their token usage and cost in
order. On supported tools, inspect a turn's recorded narration, reasoning, and exact tool
calls and results right in the terminal.
Use [ / ] to move between turns. Tool results start as compact previews;
click a result or press Enter to expand the output marked ▸ (the section at
the top of the viewport, or the next below it). z expands the whole turn,
including full arguments and output.
The Tools view groups usage by tool and MCP server. Its treemap separates tools that ran often from those associated with expensive calls, with exact figures underneath. Attribution comes from the model turns that used each tool; calls in the same turn share that turn's usage.
A large token count is only the beginning. Token economics puts each token type's share of the volume beside its share of the cost at API list rates: uncached input, output, reasoning, cache reads, and cache writes.
See how much of your usage is cached, and which token types account for the money. Drill into a model within a month or project, or in Trends over the active date range, to see its own economics and the sessions that used it, ranked by that model's contribution.
The Context view follows the window as it grows, marks compactions, and estimates what went into it: tool results, call arguments, assistant text, prompts, and more. See when the context shrank and what it grew back to.
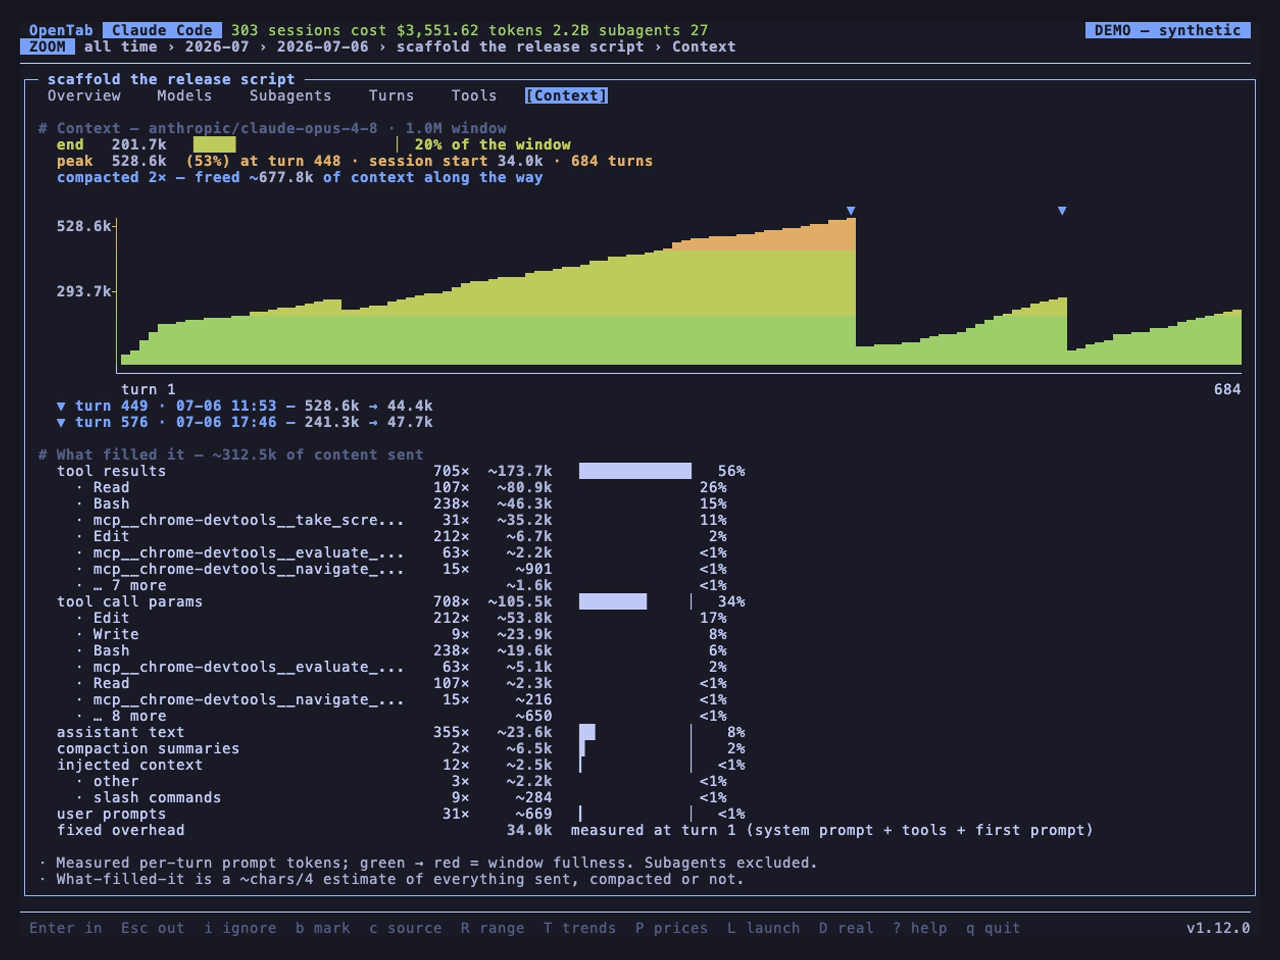
Two compactions, and the context fills again. The curve shows when; the breakdown shows what was sent. Anonymized demo data.
Session lists also show Worked time where the records support it: the agent's working bursts, with idle waits for your next prompt removed.
Press w, choose a model, and open a session. Compare the list-price cost of the
models it used with the cost of those same tokens at your chosen model's rates. Sessions
with subagents also show the target price beside each agent's usage.
Explore models you've used or the full bundled catalog. P compares model and
provider rates using your token mix, including cache usage, and lets you pin a
shortlist. Both sides of a session comparison use list rates; it holds token usage fixed
and makes no prediction about another model's output quality or how many tokens it would use.
Detail views depend on what each tool records. Compare support below.
Move between daily, weekly, and monthly trends, a calendar heatmap, and rankings of models, providers, projects, and coding tools. Follow a chart or a ranking into the sessions behind it. Filter as you type, change the date range, and keep exploring.
L. Launch through tmux, Herdr, or a
custom launcher, or copy a ready-to-run resume command.e to export the current list to CSV, including
the filters and scope you've chosen.Keys & navigation · Watch the full narrated tour on YouTube
opentab web                        # open the live browser on localhost
opentab --html report.html          # write a self-contained report
opentab --demo --html demo.html    # anonymize it for sharing
The web browser shares the TUI's navigation, themes, trends, and model comparisons. The live version fetches Turns, Tools, and Context on demand where supported. The HTML export packages the overview and comparison views into one file you can open offline, with no server or dependencies. Links to months, days, and sessions let someone open the part you want to show them.
Keep exploring in the browser. The same history, with familiar keys and clickable tables.
Turn traces and personal notes are absent from web reports; the TUI and gated CLI/MCP API provide separate access. The static HTML report omits the live Turns, Tools, and Context tabs. Web browser & exports.
Your laptop, workstation, and remote box can all contribute to the same view.
opentab pull gathers their usage summaries over SSH and opens them together with
this machine's history. Filter any view by machine, compare projects across boxes, or
reopen a supported session on the machine where it ran.
opentab pull laptop workstation gpu-box
opentab pull                              # refresh your saved machines next time
opentab remote                            # browse the last pull without reconnecting
Each remote needs opentab on its PATH. No background agent or listening service
is needed for SSH pulls. Summaries contain no raw traces. Opening a supported remote
turn in the TUI explicitly fetches just that turn over SSH; Esc cancels, and closing
and reopening retries a failed read. Ordinary browsing stays offline. Remote traces
need a managed cached summary, saved SSH connection and compatible remote OpenTab CLI.
SSH setup, portable exports, and managing machines.
Keep an eye on a session while it runs. herdr-opentab puts each running agent's cost beside it in the Herdr sidebar, subagents included.
For your own status bar or script, opentab cost "$PWD" prints the latest session's
cost for that project. opentab --goto "$PWD" opens that session for inspection.
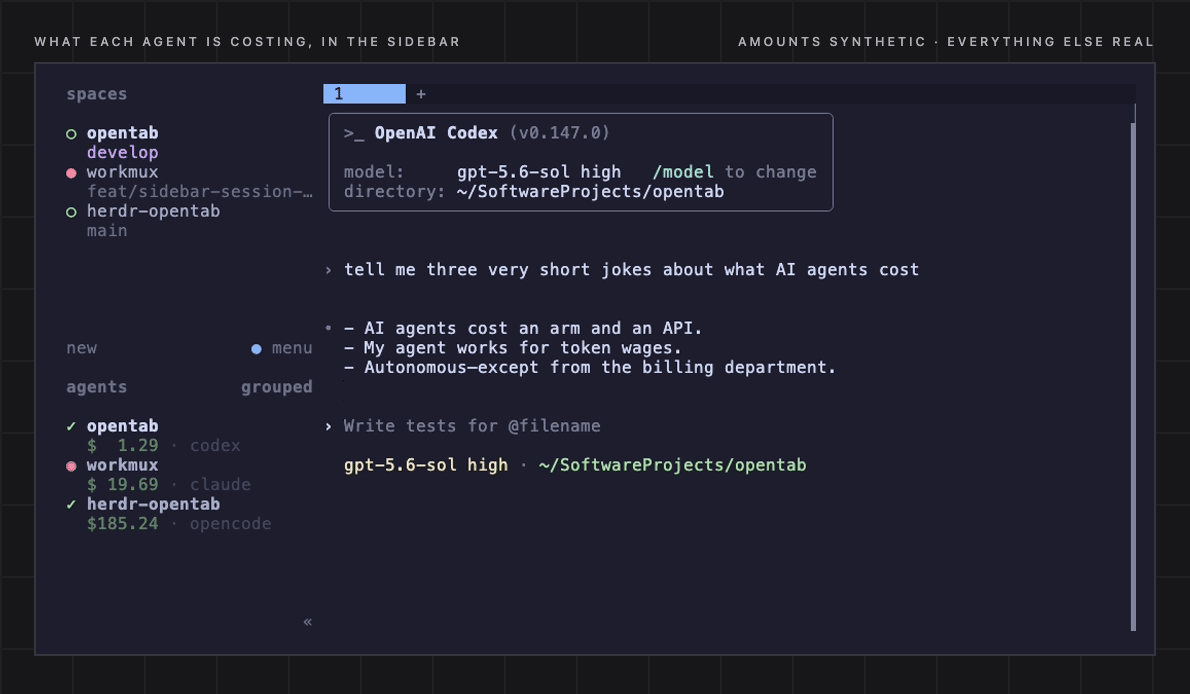
Amounts synthetic, everything else real.
OpenCode · Claude Code · Codex CLI · GitHub Copilot (CLI and Copilot Chat in VS Code) · pi-agent · omp · OpenClaw · zaly · Gemini CLI · Antigravity · Hermes · and CSV/JSONL logs of your own API requests.
Use H to switch tools live, or opentab --harness NAME to start with one.
You can also hand it a file: opentab requests.csv or opentab path/to/opencode.db.
| Harness | Cost | Subagent tree | Turns | Trace | Tools | Context |
|---|---|---|---|---|---|---|
| OpenCode | real recorded | ✓ | ✓ | ✓ | ✓ | ✓ |
| Claude Code | tokens only — $ estimates | ✓ | ✓ | ✓ | ✓ | ✓ |
| Codex CLI | tokens only — $ estimates | ✓ | ✓ | ✓ | ✓ | — |
| Hermes Agent | mixed — metered real, rest estimated | ✓ | ✓ | ✓ | ✓ | ✓ |
| GitHub Copilot CLI | tokens only — $ estimates | — | ✓ | — | — | ✓ |
| Copilot Chat in VS Code | tokens only — $ estimates | — | ✓ | — | — | ✓ |
| pi-agent | mixed — metered real, rest estimated | — | ✓ | ✓ | ✓ | ✓ |
| omp | mixed — metered real, rest estimated | ✓ | ✓ | ✓ | ✓ | ✓ |
| OpenClaw | mixed — metered real, rest estimated | — | ✓ | ✓ | ✓ | ✓ |
| zaly | mixed — metered real, rest estimated | — | ✓ | ✓ | ✓ | ✓ |
| Gemini CLI | tokens only — $ estimates | ✓ | ✓ | ✓ | ✓ | ✓ |
| Antigravity | tokens only — $ estimates | ✓ | ✓ | — | ✓ | ✓ |
| CSV / JSONL request logs | mixed — per-row cost column | — | ✓ | — | ✓ | ✓ |
Subagent tree — recursive per-subagent cost under the session that delegated ·
Turns — the per-turn cost timeline · Trace — one turn's recorded narration,
reasoning and exact calls/results, local to the TUI · Tools — token attribution per
tool call and MCP server · Context — the context-window growth curve (it rides on
Turns). A — means the required data or a safe mapping is unavailable; sources.md says
which, and why, for each one.
Data locations, setup, and the CSV/JSONL schema. Some tools need setup,
such as Copilot CLI's opt-in telemetry export; opentab doctor helps you find the gaps.
[!TIP] Keep the history you want to explore. Claude Code and Gemini CLI can delete old local records automatically. OpenTab can only show what remains on disk. Check your retention settings.
Recorded spend comes from your tools' own records. A subscription session can record
millions of tokens and $0.00 of per-token cost; your subscription is billed elsewhere.
API-equivalent estimates add list-price costs for that unpriced usage. This view is
on by default and your choice is remembered; $ toggles it. Model rates ship in a
bundled models.dev catalog, so ordinary browsing works offline. Refresh them when you
choose with r in the P price table or opentab --refresh-models.
Estimates help you compare usage. Your provider's invoice may include subscriptions, discounts, credits, or markups that local records cannot tell OpenTab about. Pricing explained.
Local browsing needs no cloud service or account and sends no telemetry. Your agents' files are opened read-only; OpenTab writes its own preferences, notes, caches, and the exports you request.
You control transfers: remote pulls fetch summaries from machines you choose, a price refresh fetches the models.dev catalog, and exports go wherever you put them. The live web browser binds to localhost by default. Privacy details.
Use opentab --demo, or D in-app, to anonymize titles, paths, prompt text, and
absolute spend/token numbers in memory. The shape of the data stays real. Demo mode
never writes those changes back to your history or saves your browsing state.
opentab --demo --html demo.html creates an anonymized report. You can also choose
which categories to scramble; demo mode details.
Claude Code deletes local transcripts after 30 days by default, and Gemini CLI's
default retention removes chat recordings older than 30 days on launch. Once the
source record disappears, its usage disappears from OpenTab too. OpenTab warns about
these settings; opentab doctor reports them.
For long history:
"cleanupPeriodDays": 3650 to $CLAUDE_CONFIG_DIR/settings.json
(default ~/.claude/settings.json)."general": {"sessionRetention": {"enabled": false}} in
~/.gemini/settings.json, merging it with any existing general settings.If it can log API requests, point OpenTab at a CSV or JSONL of them. Turns, Tools, and Context become available when the log carries the relevant optional fields. Request log schema.
For another native integration, open an issue describing the tool and its record format.
Run opentab doctor. It reports which tools it found, why others are missing, and
what to fix, along with terminal support and the price catalog. It diagnoses without
repairing or reading transcript content.
Full documentation · Troubleshooting · Windows & WSL
CI runs Ruff, unit tests, and ShellCheck. CONTRIBUTING.md covers setup, checks, and commit conventions; Architecture explains the code.
MIT — see LICENSE.
Sign in to join the discussion.
No comments yet. Be the first to say what this is good for.
🪨 why use many token when few token do trick — Claude Code skill that cuts 65% of tokens by talking like caveman

The best-benchmarked open-source AI memory system. And it's free.

Orca is the ADE for working with a fleet of parallel agents. Run any coding agent with your own subscription. Available on desktop, mobile and remote runtime.
A cross-platform desktop All-in-One assistant for Claude Code, Codex, OpenCode, OpenClaw, Grok Build & Hermes Agent. Only official website: ccswitch.io

Never stop coding. Free MIT AI gateway: one endpoint, 352 providers (150+ free), 1200+ models Kimi, Claude, GPT, Gemini, GLM, DeepSeek, MiniMax. Works with Claude Code, Codex, Cursor, OpenCode, Cline & Copilot. Quota-aware auto-fallback, RTK+Caveman compression saves 15-95% tokens, MCP/A2A, Desktop/PWA. Built by 550+ contributors

Compress tool outputs, logs, files, and RAG chunks before they reach the LLM. 20% fewer tokens for coding agents, 60-95% fewer tokens for JSON, same answers. Library, proxy, MCP server.