
MemPalace/
mempalace

MemPalace/mempalaceTools
The best-benchmarked open-source AI memory system. And it's free.
59k
`claude-meter` sits between Claude Code and Anthropic, captures request and response signals locally, then turns them into normalized records and rough budget estimates. It includes a live dashboard, CLI logging, and offline analysis scripts so you can inspect 5h and 7d utilization windows over time.
Builders who run Claude Code and want to study their usage limits locally.
You can trace Claude Code traffic and estimate rough quota bands instead of guessing from the app UI.
Forwards Claude Code traffic to Anthropic while capturing requests, responses, and rate-limit signals locally.
Writes raw JSONL exchanges under `~/.claude-meter/raw/` with redacted sensitive headers and private permissions.
Parses `/v1/messages`, `/v1/messages/count_tokens`, and streamed SSE responses into normalized JSONL under `~/.claude-meter/normalized/`.
Summarizes observed windows, token breakdowns, and rough 5h and 7d budget estimates from the normalized logs.
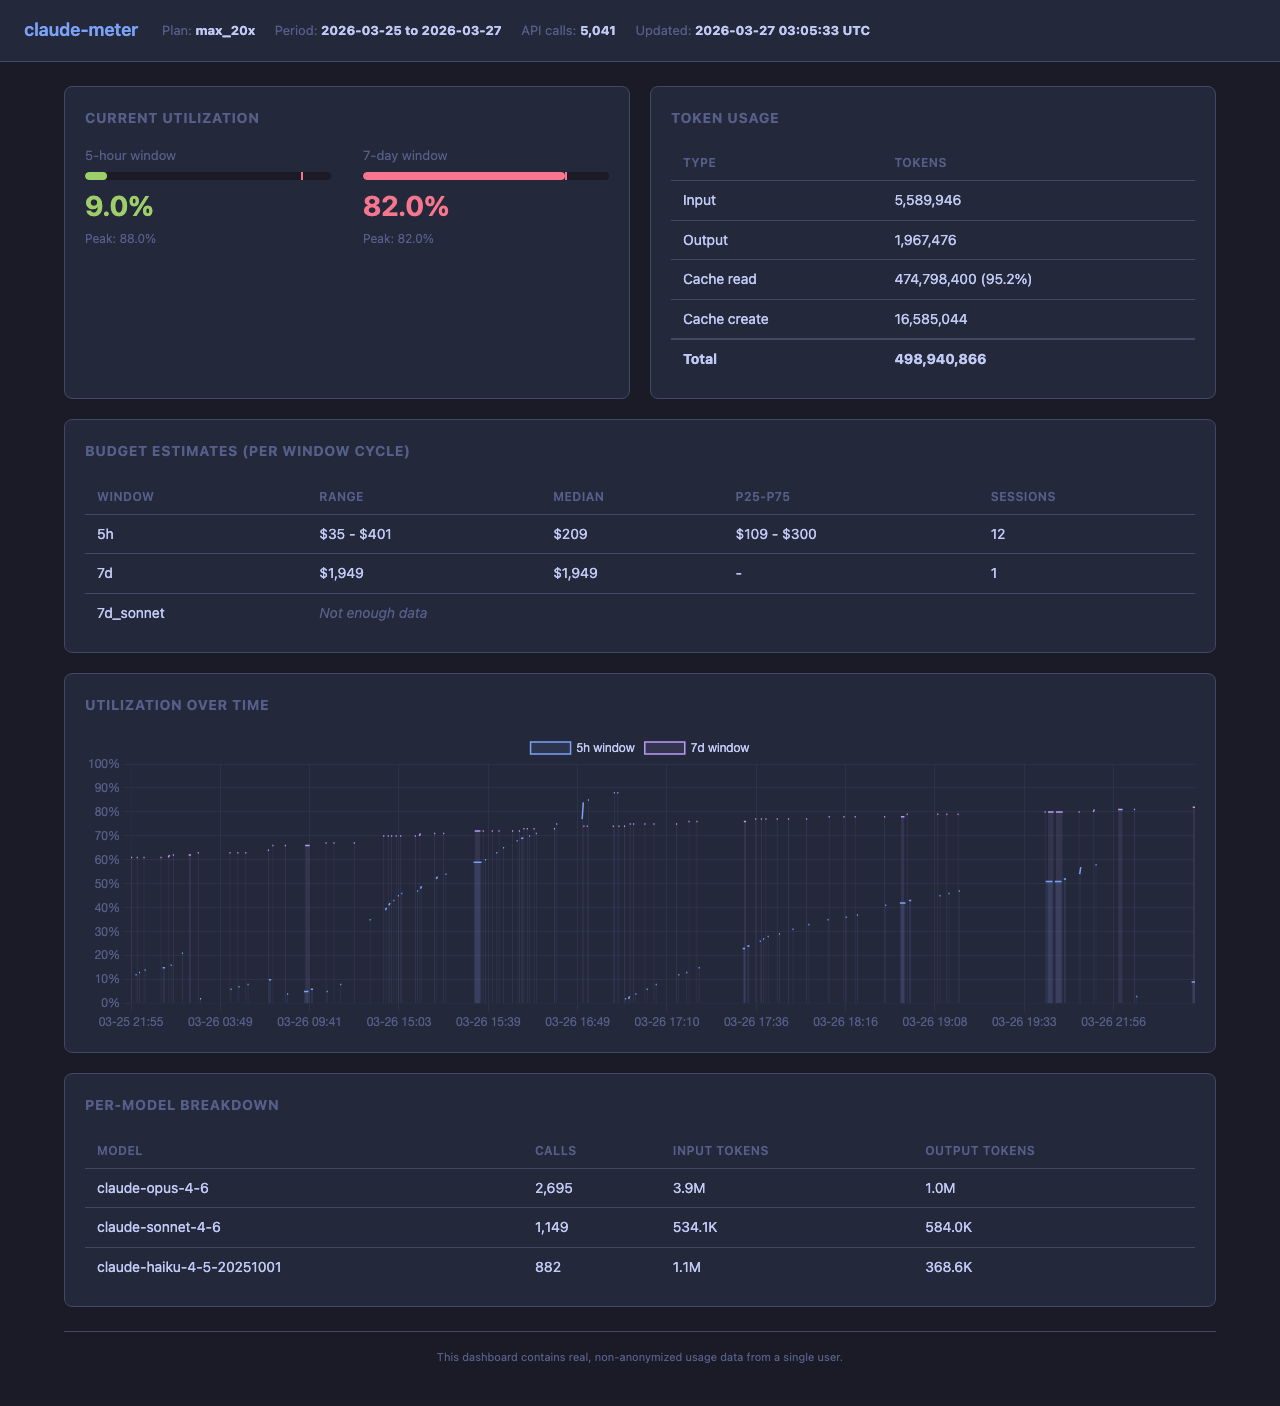
Serves a local dashboard at `http://localhost:7735` with utilization gauges, charts, and auto-refresh.
Adds the `ANTHROPIC_BASE_URL` proxy setting to your shell with `claude-meter setup`.
curl -sSL https://raw.githubusercontent.com/abhishekray07/claude-meter/main/install.sh | bash
git clone https://github.com/abhishekray07/claude-meter.git
cd claude-meter
go build -o claude-meter ./cmd/claude-meter
./claude-meter start --plan-tier max_20x
claude-meter setup
go run ./cmd/claude-meter start --plan-tier max_20x
ANTHROPIC_BASE_URL=http://127.0.0.1:7735 claude
go run ./cmd/claude-meter backfill-normalized --log-dir ~/.claude-meter --plan-tier max_20x
claude-meter is a local research proxy for understanding how Claude Code usage maps to Anthropic's hidden quota system.
The core problem is simple:
5h and 7dclaude-meter sits between Claude Code and Anthropic, captures those signals locally, normalizes them, and helps estimate rough budget bands from real traffic.
This project is currently an alpha research tool, not a polished end-user product.
What that means:
The right way to think about the project today is:
working local proxyworking local data captureworking local normalizationearly-stage estimatorThe immediate goal is to answer questions like:
5h and 7d quota windows does Claude Code actually see?5h budget band with enough confidence to track changes over time?The longer-term goal is bigger:
api.anthropic.com--status-intervalhttp://localhost:7735 with auto-refreshsetup subcommand to auto-configure your shell~/.claude-meter/raw/~/.claude-meter/normalized//v1/messages parsing/v1/messages/count_tokens parsingFrom live Claude Code traffic, claude-meter can already capture:
anthropic-ratelimit-unified-* headers5h and 7d utilization windows7d_sonnet when presentinput_tokensoutput_tokenscache_creation_input_tokenscache_read_input_tokensThe current analysis layer can already:
5h estimate bands--summary flagThese are important gaps, not footnotes:
In particular, the estimator still has outliers. That is expected at this stage. The data capture is real; the hard part is interpreting a coarse hidden utilization meter.
The current working thesis is:
5h meter better than raw token totalsrough 5h budget band, not a fake exact capSo the project is moving toward:
5h budget”N tokens remaining”ANTHROPIC_BASE_URLThis separation is deliberate:
curl -sSL https://raw.githubusercontent.com/abhishekray07/claude-meter/main/install.sh | bash
git clone https://github.com/abhishekray07/claude-meter.git
cd claude-meter
go build -o claude-meter ./cmd/claude-meter
./claude-meter start --plan-tier max_20x
claude-meter setup
This detects your shell (bash, zsh, fish) and adds the ANTHROPIC_BASE_URL export to your rc file so Claude Code always routes through the proxy.
Run the proxy:
go run ./cmd/claude-meter start --plan-tier max_20x
Point Claude Code at it (or use claude-meter setup to make this permanent):
ANTHROPIC_BASE_URL=http://127.0.0.1:7735 claude
Backfill normalized records from existing raw logs:
go run ./cmd/claude-meter backfill-normalized --log-dir ~/.claude-meter --plan-tier max_20x
Run the analyzer (human-readable summary):
python3 analysis/analyze_normalized_log.py ~/.claude-meter --summary
This reads all normalized logs and outputs:
claude-meter analysis
========================================

Plan: max_20x
API calls: 4,721
Period: 2026-03-25 21:55 -> 2026-03-26 22:15

Token Usage
--------------------
  Input:             5,509,548
  Output:            1,850,132
  Cache read:      443,884,520 (95.1%)
  Cache create:     15,574,984

Current Utilization
--------------------
  5h           2% (peak: 88%)
  7d           81% (peak: 81%)
  7d_sonnet    37% (peak: 37%)

Estimated 5h Budget (11 sessions observed)
--------------------
  Range:   $35 - $401
  Median:  $164
  p25-p75: $99 - $291

Estimated 7d Budget (1 session observed)
--------------------
  Estimate: ~$1,949

By Model
--------------------
  claude-opus-4-6                          2,423 calls
  claude-sonnet-4-6                        1,146 calls
  claude-haiku-4-5-20251001                  855 calls
For raw JSON output (e.g. for piping to other tools):
python3 analysis/analyze_normalized_log.py ~/.claude-meter/normalized/2026-03-26.jsonl --pretty
Generate charts and a markdown report:
python3 analysis/report.py ~/.claude-meter --output /tmp/cm-report
When the proxy is running, every API request is logged to stderr with color-coded output:
Utilization colors: green (<50%), yellow (50-80%), red (>=80%). Respects NO_COLOR for plain output.
Use --status-interval N to print a periodic summary every N requests showing total counts, per-model breakdown, and current utilization.
The dashboard is built into the proxy. Just open your browser:
http://localhost:7735
When the proxy is running, visiting that URL in a browser serves a live dashboard with utilization gauges, budget estimates, and time-series charts. API requests from Claude Code continue to proxy normally.
You can also generate a standalone HTML file:
python3 analysis/dashboard.py ~/.claude-meter --output index.html --open
Publish to GitHub Pages with one command:
make dashboard
This generates the HTML from your local data, then pushes it to the gh-pages branch.
Right now this is intentionally local-first.
This is acceptable for a research tool, but it is not yet the final product privacy posture.
5h estimate bandsOne account can tell you:
5h band looks likeMany accounts can tell you:
Pro, Max, and higher tiers behave differentlyThat is why the long-term value is not just local observability. It is eventually building a better map of the hidden system.
If you use claude-meter today, use it as:
Do not use it yet as:
Sign in to join the discussion.
No comments yet. Be the first to say what this is good for.
The best-benchmarked open-source AI memory system. And it's free.

Never stop coding. Free MIT AI gateway: one endpoint, 352 providers (150+ free), 1200+ models Kimi, Claude, GPT, Gemini, GLM, DeepSeek, MiniMax. Works with Claude Code, Codex, Cursor, OpenCode, Cline & Copilot. Quota-aware auto-fallback, RTK+Caveman compression saves 15-95% tokens, MCP/A2A, Desktop/PWA. Built by 550+ contributors

Compress tool outputs, logs, files, and RAG chunks before they reach the LLM. 20% fewer tokens for coding agents, 60-95% fewer tokens for JSON, same answers. Library, proxy, MCP server.

Turn any technical book PDF into a Claude Code skill — ready to study, reference, and use while you work.

OfficeCLI is the first and best Office suite purpose-built for AI agents to read, edit, and automate Word, Excel, and PowerPoint files. Free, open-source, single binary, no Office installation required.

Use ChatGPT Web (including Pro) as a native model in Codex — with context, tools, streaming and images, without using Codex quota.