

JuliusBrussee/
caveman

🪨 why use many token when few token do trick — Claude Code skill that cuts 65% of tokens by talking like caveman
105k
1 add
PI Dashboard is a browser and Electron interface for pi sessions. It groups sessions, mirrors live chat, lets you send prompts back, shows terminals and diffs, and can launch new sessions from the same place. It also exposes a `POST /mcp` endpoint for MCP clients and supports remote access through mDNS or zrok.
Builders who use pi and want to monitor, steer, and review multiple agent sessions from one tab.
You can manage live agent work without switching between terminal windows and separate tools.
Shows active pi sessions in real time, with streaming messages, timing, token counts, and context usage.
Lets you send prompts and commands back into a running session from the browser.
Provides an integrated terminal, side-by-side or unified diffs, and file navigation for agent work.
Displays flow runs, agent cards, flow graphs, and controls for aborting or auto-running flows.
Lets you install pi packages and configure AI providers, credentials, and tool overrides from the UI.
Supports mDNS discovery and optional zrok tunnels so you can reach the dashboard from another device.
Exposes dashboard sessions to MCP clients through `POST /mcp` with bearer authentication.
xattr -cr /Applications/PI-Dashboard.app
npm install -g @blackbelt-technology/pi-agent-dashboard
pi-dashboard
# open http://localhost:8000
pi install npm:@blackbelt-technology/pi-agent-dashboard
pi
🌐 Dashboard started at http://localhost:8000
git clone https://github.com/BlackBeltTechnology/pi-agent-dashboard.git
cd pi-agent-dashboard
corepack enable                            # activates the pinned pnpm (packageManager field)
pnpm install
pnpm run build                             # one-time client build
pi install /path/to/pi-agent-dashboard     # global
# or: pi install -l /path/to/pi-agent-dashboard   # project-local only
pnpm run link:local     # symlinks `pi-dashboard` on PATH to packages/server/bin/pi-dashboard.mjs
pi-dashboard status
pnpm run unlink:local   # restore (removes the global symlink)
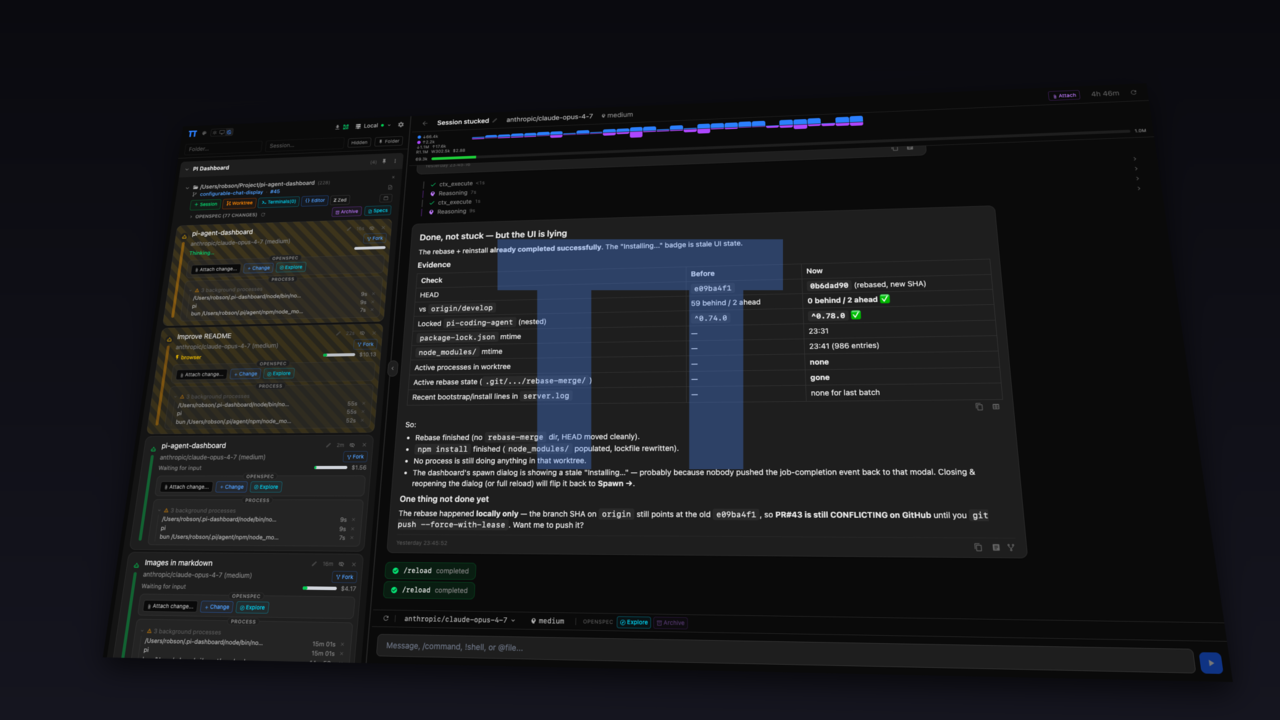


One browser tab to command an army of pi agents. Spawn parallel sessions, watch reasoning live, attach OpenSpec changes, ship work — from your laptop or phone.
🌐 Website & demo: blackbelttechnology.github.io/pi-agent-dashboard — animated tour, screenshots, and install guide.
💬 Community: Join our Discord — questions, help, and release news.
📝 Changelog: CHANGELOG.md
Note: This dashboard only works with pi. Oh My Pi is not supported.
 Overview — sessions grouped by folder, branch & OpenSpec context, live cost |  Session — chat, OpenSpec apply, interactive ask_user, context gauge |  Settings — ports, spawn strategy, zrok tunnel, tool resolution |
Three install paths, pick one:
Download a pre-built installer from GitHub Releases:
| Platform | Download |
|---|---|
| macOS (Apple Silicon / Intel) | .dmg (arm64 / x64) |
| Linux (x64 / ARM64) | .deb or .AppImage |
| Windows (x64 / ARM64) | .zip |
macOS requirement: macOS 12 (Monterey) or newer — Intel and Apple Silicon both supported. macOS 10.15 (Catalina) and 11 (Big Sur) are not supported; users on those versions keep their currently installed version (Electron 32) and are not offered the newer update.
On first launch a setup wizard walks you through mode selection (standalone vs. power-user), API key / OAuth sign-in, and recommended extensions. The standalone mode bundles Node.js and auto-installs pi + dashboard + openspec into ~/.pi-dashboard/ — no terminal, npm, or Node.js required.
Picking the right macOS DMG: run uname -m in Terminal — arm64 means Apple Silicon (M1/M2/M3/M4), x86_64 means Intel. Or open Apple menu → About This Mac and read the chip name. Download the matching DMG; if you grab the wrong one macOS will refuse to launch the app with a "cannot be opened" error.
First-run unblocking (unsigned binaries):
PI-Dashboard.app → Open the first time, or clear all extended attributes from Terminal:
xattr -cr /Applications/PI-Dashboard.app
-cr (clear, recursive) rather than -d com.apple.quarantine — it's idempotent and won't print No such xattr: com.apple.quarantine when the attribute isn't there. That message is harmless; it just means quarantine was never set or already cleared..exe / .zip → Properties → tick Unblock → OK before running. For ZIPs, unblock the archive before extracting.Note: A future release will rename the macOS DMGs to
PI-Dashboard-darwin-arm64-<ver>.dmgandPI-Dashboard-darwin-x64-<ver>.dmg(previously a singlePI Dashboard.dmgwas produced and silently overwrote one arch on each release). Direct download links pointing at the unsuffixed filename will 404 from that release onward; please link to the Releases page instead. See OpenSpec changefix-darwin-dmg-arch-collision.
If you don't have pi yet, you can install the dashboard directly via npm — pi/openspec/tsx ship as regular npm dependencies, so a single install brings everything in:
npm install -g @blackbelt-technology/pi-agent-dashboard
pi-dashboard
# open http://localhost:8000
If pi is already installed, the bridge-extension flow is equivalent:
pi install npm:@blackbelt-technology/pi-agent-dashboard
pi
The bridge extension auto-starts the dashboard server on first launch:
🌐 Dashboard started at http://localhost:8000
Open http://localhost:8000 in any browser. All active pi sessions appear automatically. See Prerequisites for Node.js / build-tool requirements.
Windows has a few extra one-time setup steps. Run the following in an Administrator PowerShell session:
# 1. Enable long paths (required — npm node_modules nesting exceeds 260 chars)
reg add "HKLM\SYSTEM\CurrentControlSet\Control\FileSystem" /v LongPathsEnabled /t REG_DWORD /d 1 /f

# 2. Install Node.js LTS 22 via winget (ships >= 22.19 so no node-guard refusal)
winget install -e --id OpenJS.NodeJS.LTS --accept-source-agreements --accept-package-agreements

# 3. CLOSE this PowerShell, open a NEW one as Administrator (PATH refresh)

# 4. Verify
node --version    # expect v22.19+ (any 22.x >= 22.19, NOT v22.0–v22.18)
npm --version     # expect 10.x

# 5. Install
npm install -g @blackbelt-technology/pi-agent-dashboard

# 6. Start (foreground first time so you can see any errors)
pi-dashboard start

# 7. From the browser
start http://localhost:8000
C++ build tools are typically not required — node-pty ships a Windows x64 prebuild. Install Visual Studio Build Tools only if the prebuild fails to load. See docs/installation-windows.md for more detail (offline / tarball / nvm-windows caveats).
Before your first change, read CONTRIBUTING.md — features and bugfixes go through a spec-first pipeline (explore → plan → build → ship), not a plain branch-and-PR flow.
git clone https://github.com/BlackBeltTechnology/pi-agent-dashboard.git
cd pi-agent-dashboard
corepack enable                            # activates the pinned pnpm (packageManager field)
pnpm install
pnpm run build                             # one-time client build
pi install /path/to/pi-agent-dashboard     # global
# or: pi install -l /path/to/pi-agent-dashboard   # project-local only
pi-dashboard commandBy default, pi-dashboard on your PATH refers to whatever copy was installed globally (via npm i -g or the Electron bundle). To make it point at your working tree instead — so every edit is live and bridge auto-start uses your changes — link the workspace:
pnpm run link:local     # symlinks `pi-dashboard` on PATH to packages/server/bin/pi-dashboard.mjs
pi-dashboard status
pnpm run unlink:local   # restore (removes the global symlink)
The link survives across shells. Every invocation — including pi's bridge auto-spawn — runs packages/server/src/cli.ts via jiti, so you don't need to rebuild the server on edits. The client still requires pnpm run build (or pnpm run dev for HMR).
Windows note: symlink creation needs an admin shell or Windows Developer Mode enabled. Everything else works the same as POSIX.
To try the extension in a single pi session without registering it:
pi -e /path/to/pi-agent-dashboard/packages/extension/src/bridge.ts
Remove with pi remove /path/to/pi-agent-dashboard. Alternatively, add the package path directly to ~/.pi/agent/settings.json (global) or .pi/settings.json (project) under "packages": [...].
Run the whole ecosystem — server, pi agent, code-server, zrok, tmux, terminals — in one container. No host install of pi, Node, or any tool.
cd docker
cp .env.example .env          # add ANTHROPIC_API_KEY (optional)
docker compose up -d --build
# open http://localhost:8000
State persists in a named volume; API keys seed into auth.json on first run (or add providers later via the UI). Mount host projects at their identical absolute paths with PI_WORKSPACES="/abs/a:/abs/b" ./up.sh (auto-pinned on first run). The Electron desktop app can attach to a Docker-hosted server via the wizard's Remote mode — no local install. Full guide, volume performance profiles, dev mode, and external-gateway config: docker/README.md. For a disposable, fully isolated instance for manual browser QA (can't collide with a running host dashboard): docker/TESTING.md.
Sessions & chat
Workspace & UI
/ prefix triggers a filtering dropdownref attributes or  and they render in chat (the bridge inlines bytes via a streaming-safe pi-asset:<hash> channel — each unique image's bytes ride exactly once per session, no matter how many streaming chunks repeat the token). Math expressions — inline $x = \beta$ and display $$\sum_i^n i$$ (block-level) — are typeset via KaTeX. PNG / JPEG / GIF / WebP / SVG / AVIF / BMP supported with a 5 MB-per-image, 20 MB-per-message cap; oversized or unreadable references render as a visible placeholder rather than a broken-image glyph. The dashboard server adds zero new HTTP routes.Integrations
MultiselectRenderer dialog) since pi 0.70's RPC mode has no working terminal-overlay primitive. First-response-wins semantics with cross-adapter dismissal.pi.events.on("ui:list-modules", probe) and push descriptors into probe.modules; the dashboard renders table / grid / form views with row actions, optional confirm-dialog gates, and MDI icons. Modules survive reconnect via the server-side cache; in pure-pi mode descriptors stay dormant. See openspec/specs/extension-ui-system/spec.md for the protocol contract.~/.pi/agent/auth.json and live-synced to running sessions.POST /mcp exposes dashboard sessions to MCP clients (Claude Desktop, Cursor) once the server runs. Every request needs a bearer credential, including localhost. ~/.pi/agent/mcp.json gets a pi-dashboard entry automatically on first server start; external clients authenticate with a paired-device token. Local pi sessions need pi-mcp-adapter >= 2.20.0.Dev tools
Networking & distribution
PI Dashboard now includes a lightweight Simplified Chinese interface for the core operator workflow: onboarding, the session sidebar, chat composer, connection banners, Settings, provider setup, and package management.
The language selector lives in Settings → General → Interface. English remains the default for existing users, and the selection is saved in the browser. Deployments that want to start in Chinese can build the web client with:
VITE_PI_DASHBOARD_DEFAULT_LANGUAGE=zh-CN pnpm --filter @blackbelt-technology/pi-dashboard-web run build
This keeps plugin-provided dynamic content, package names, model names, and command output unchanged while making the main dashboard usable for Chinese-speaking operators out of the box.
Only needed for Quickstart paths B and C. The Electron app (path A) bundles everything in standalone mode.
| Requirement | Why | Install |
|---|---|---|
| pi | The AI coding agent the dashboard monitors | npm i -g @mariozechner/pi-coding-agent |
| pi-mcp-adapter ≥ 2.20.0 | Lets local pi sessions call the dashboard's POST /mcp endpoint | pi ext update pi-mcp-adapter |
| Node.js ≥ 22.19.0 | Server runtime. Node 22.0.0–22.18.x and 24.1.0–24.2.x refused (affected by nodejs/node#58515, crashes Fastify at startup). Cap < 27 for tested range. | nodejs.org |
| C++ build tools | Required by node-pty native addon for the integrated terminal | Xcode CLI Tools (macOS) / build-essential (Linux) |
Optional:
| Tool | Purpose | When needed |
|---|---|---|
| tmux | Spawn new pi sessions in a tmux window | When spawnStrategy is "tmux" |
| zrok | Public tunnel with persistent URLs | When tunnel.enabled is true (default) |
~/.pi/dashboard/config.json (auto-created with defaults on first run)~/.pi/dashboard/tool-overrides.json — see Tool overridesCLI flags → environment variables → config file → built-in defaults.
| CLI flag | Env var | Config key | Default | Description |
|---|---|---|---|---|
--port | PI_DASHBOARD_PORT | port | 8000 | HTTP + browser WebSocket port |
--pi-port | PI_DASHBOARD_PI_PORT | piPort | 9999 | Pi extension WebSocket port |
--dev | — | — | false | Development mode (proxy to Vite) |
--no-tunnel | — | tunnel.enabled | true | Disable zrok tunnel |
| — | — | autoStart | true | Bridge auto-starts server if not running |
| — | — | autoShutdown | false | Server shuts down when idle |
| — | — | shutdownIdleSeconds | 300 | Seconds idle before auto-shutdown |
| — | — | spawnStrategy | "headless" | Session spawn mode: "headless" or "tmux" |
| — | — | reattachPlacement | "always" | After a dashboard restart, where re-registering bridges land in folder lists. "always" (top), "streaming-only" (only mid-completion), "preserve" (legacy: keep prior drag order) |
| — | — | devBuildOnReload | false | Rebuild client + restart server on /reload |
| — | — | askUserPromptTimeoutSeconds | 300 | ask_user prompt timeout in seconds. ≤ 0 (e.g. -1) = wait indefinitely |
| — | PI_CODING_AGENT_SESSION_DIR | piSessionsDir | ~/.pi/agent/sessions | Pi sessions root the dashboard scans. See Pi sessions directory |
The bridge also honours PI_DASHBOARD_URL=ws://host:port to point at a remote server instead of localhost.
The dashboard is a separate process from pi, so it resolves one sessions root to scan. When pi's sessions live somewhere other than the default, point the dashboard at them via the following precedence (first match wins; blank values fall through, leading ~/ expands against $HOME):
config.json#piSessionsDir — operator's explicit dashboard override.PI_CODING_AGENT_SESSION_DIR — pi's session-dir env var, if inherited by the dashboard process.PI_CODING_AGENT_DIR + /sessions — pi's agent-dir relocation env var.~/.pi/agent/sessions — built-in default.Omit piSessionsDir (or leave it blank) to fall through to the env vars and default. Per-invocation --session-dir flags on other pi processes are not observable to the dashboard and are out of scope.
config.json{
"port": 8000,
"piPort": 9999,
"autoStart": true,
"autoShutdown": false,
"shutdownIdleSeconds": 300,
"spawnStrategy": "headless",
"tunnel": { "enabled": true, "reservedToken": "auto-created-on-first-run" },
"devBuildOnReload": false,
"askUserPromptTimeoutSeconds": 300,
"openspec": {
"pollIntervalSeconds": 30,
"maxConcurrentSpawns": 3,
"changeDetection": "mtime",
"jitterSeconds": 5
}
}
OAuth2 authentication guards external (tunnel) access. Localhost is always unguarded.
{
  "auth": {
    "secret": "auto-generated-if-omitted",
    "providers": {
      "github":   { "clientId": "...", "clientSecret": "..." },
      "google":   { "clientId": "...", "clientSecret": "..." },
      "keycloak": { "clientId": "...", "clientSecret": "...", "issuerUrl": "https://keycloak.example.com/realms/myrealm" }
    },
    "allowedUsers": ["octocat", "user@example.com", "*@company.com"]
  }
}
| Key | Required | Description |
|---|---|---|
auth.secret | No | JWT signing secret (auto-generated if omitted) |
auth.providers | Yes | Map of provider → { clientId, clientSecret, issuerUrl? } |
auth.allowedUsers | No | Allowlist: usernames, emails, or *@domain wildcards. Empty = allow all |
Supported providers: github, google, keycloak, oidc (generic OIDC with issuerUrl).
Callback URL: register https://<tunnel-url>/auth/callback/<provider> in your OAuth provider settings. The tunnel URL is stable across restarts (reserved shares are auto-created).
Security note:
/api/spawn-failuresis reachable to any caller on deployments without auth; entries containcwdpaths. Enable auth before exposing via tunnel.
The dashboard auto-connects a zrok tunnel on start when tunnel.enabled is true. Install with brew install zrok (macOS) and run zrok enable <token> to enrol — the dashboard reads zrok's own config (~/.zrok2/environment.json), no keys are stored in the dashboard. Reserved shares provide persistent URLs across restarts.
Tune how often the server polls known directories for OpenSpec updates (openspec block):
| Key | Default | Range | Description |
|---|---|---|---|
pollIntervalSeconds | 30 | 5–3600 | How often each known directory is polled |
maxConcurrentSpawns | 3 | 1–16 | Cap on concurrent openspec CLI invocations |
changeDetection | "mtime" | "mtime" | "always" | mtime skips unchanged proposals; always polls unconditionally |
jitterSeconds | 5 | 0–60 | Per-directory phase offset so polls don't align on the same tick |
Live-reconfigurable via Settings → Advanced → "Background polling (OpenSpec)" or PUT /api/config — no server restart needed. See docs/architecture.md for the cost model.
The dashboard resolves every external tool it calls (pi, pi-coding-agent, openspec, npm, node, tsx, git, zrok, pi-dashboard) through a single ToolRegistry. Each tool has an ordered strategy chain (override → managed install → bare-import / npm-global → PATH search), and every resolution records a diagnostic trail.
Inspecting and overriding — Settings → General → Tools shows every resolved tool, its source, and the trail. You can set a per-tool override path, rescan individually or all at once, and export the full diagnostic report.
Overrides file
Sign in to join the discussion.
No comments yet. Be the first to say what this is good for.
🪨 why use many token when few token do trick — Claude Code skill that cuts 65% of tokens by talking like caveman

The best-benchmarked open-source AI memory system. And it's free.

Orca is the ADE for working with a fleet of parallel agents. Run any coding agent with your own subscription. Available on desktop, mobile and remote runtime.
A cross-platform desktop All-in-One assistant for Claude Code, Codex, OpenCode, OpenClaw, Grok Build & Hermes Agent. Only official website: ccswitch.io

Never stop coding. Free MIT AI gateway: one endpoint, 352 providers (150+ free), 1200+ models Kimi, Claude, GPT, Gemini, GLM, DeepSeek, MiniMax. Works with Claude Code, Codex, Cursor, OpenCode, Cline & Copilot. Quota-aware auto-fallback, RTK+Caveman compression saves 15-95% tokens, MCP/A2A, Desktop/PWA. Built by 550+ contributors

Compress tool outputs, logs, files, and RAG chunks before they reach the LLM. 20% fewer tokens for coding agents, 60-95% fewer tokens for JSON, same answers. Library, proxy, MCP server.